Everyone agrees: 2024 the hottest year since the thermometer was invented
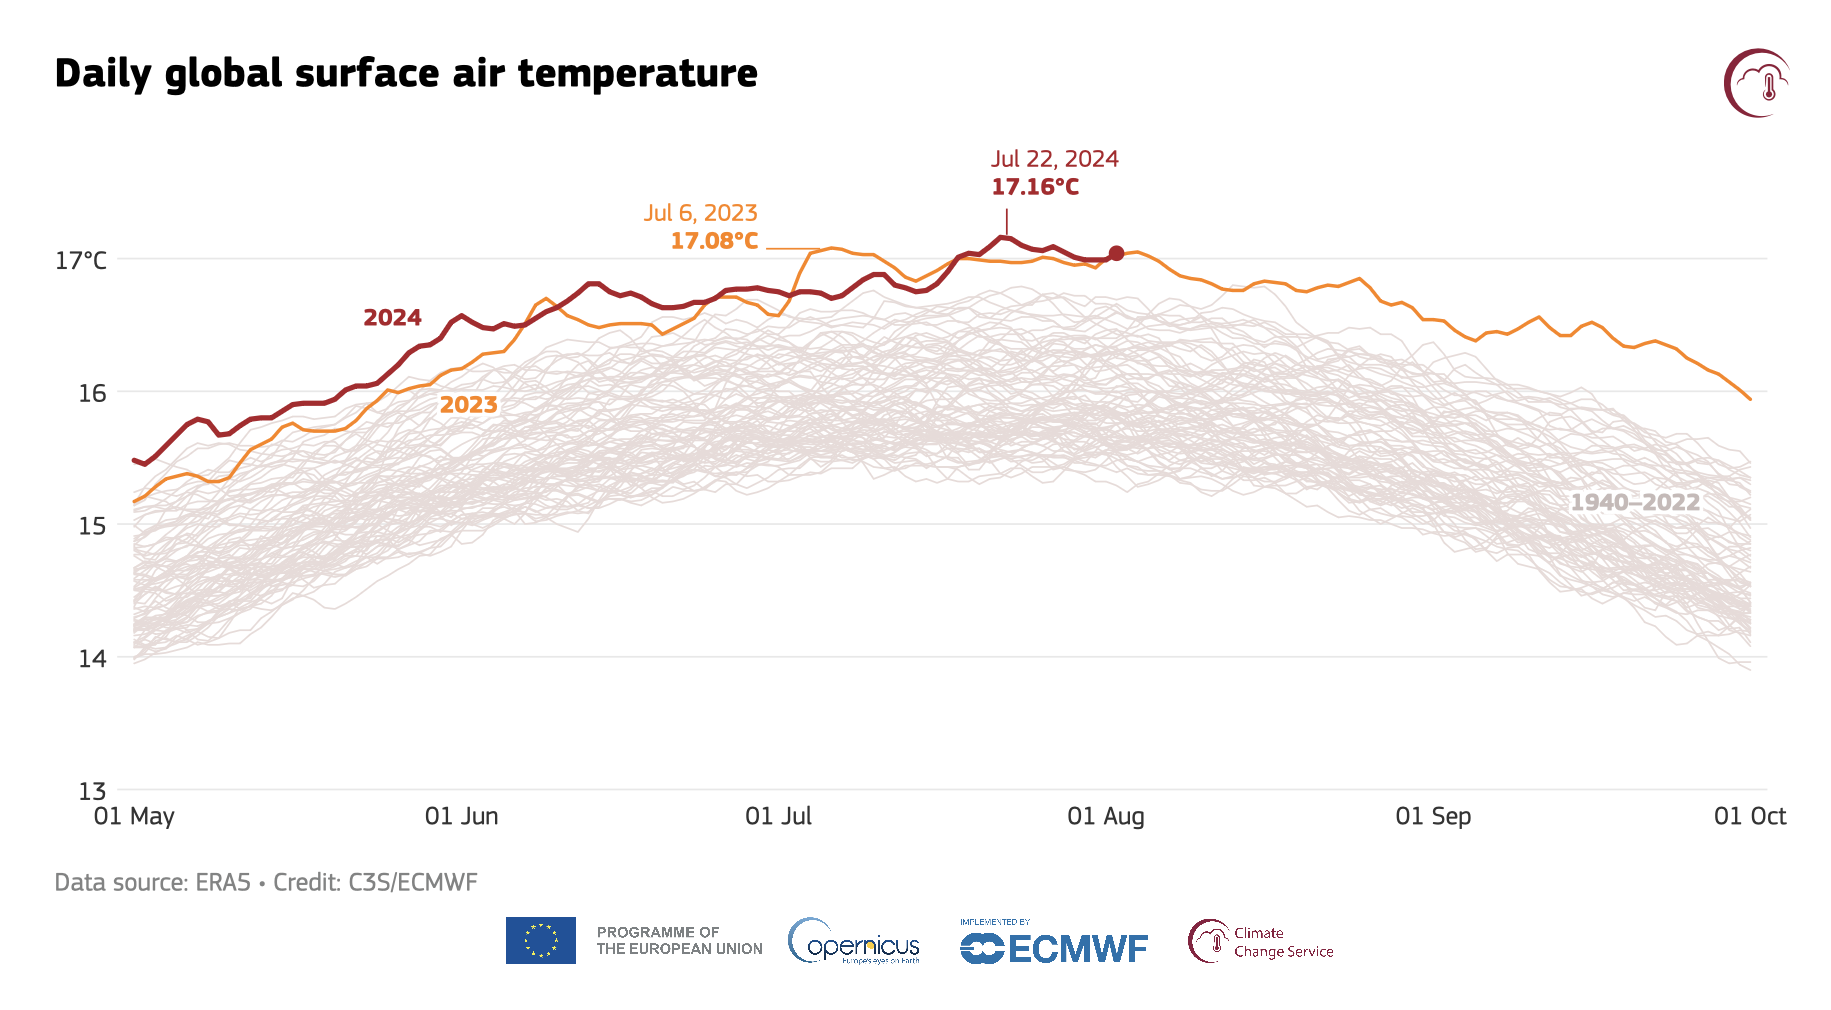
An exceptionally hot outlier, 2024 means the streak of hottest years goes to 11.
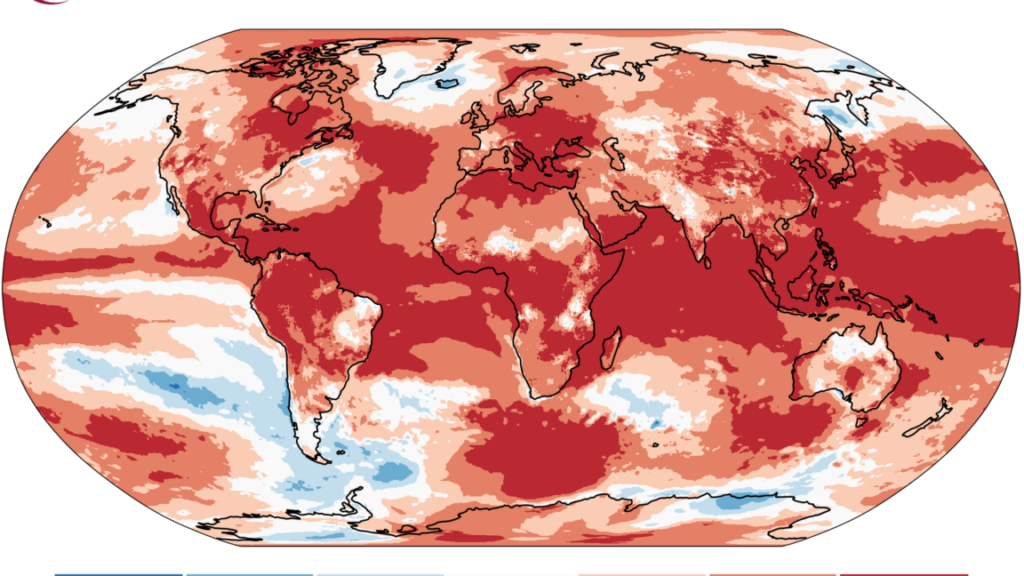
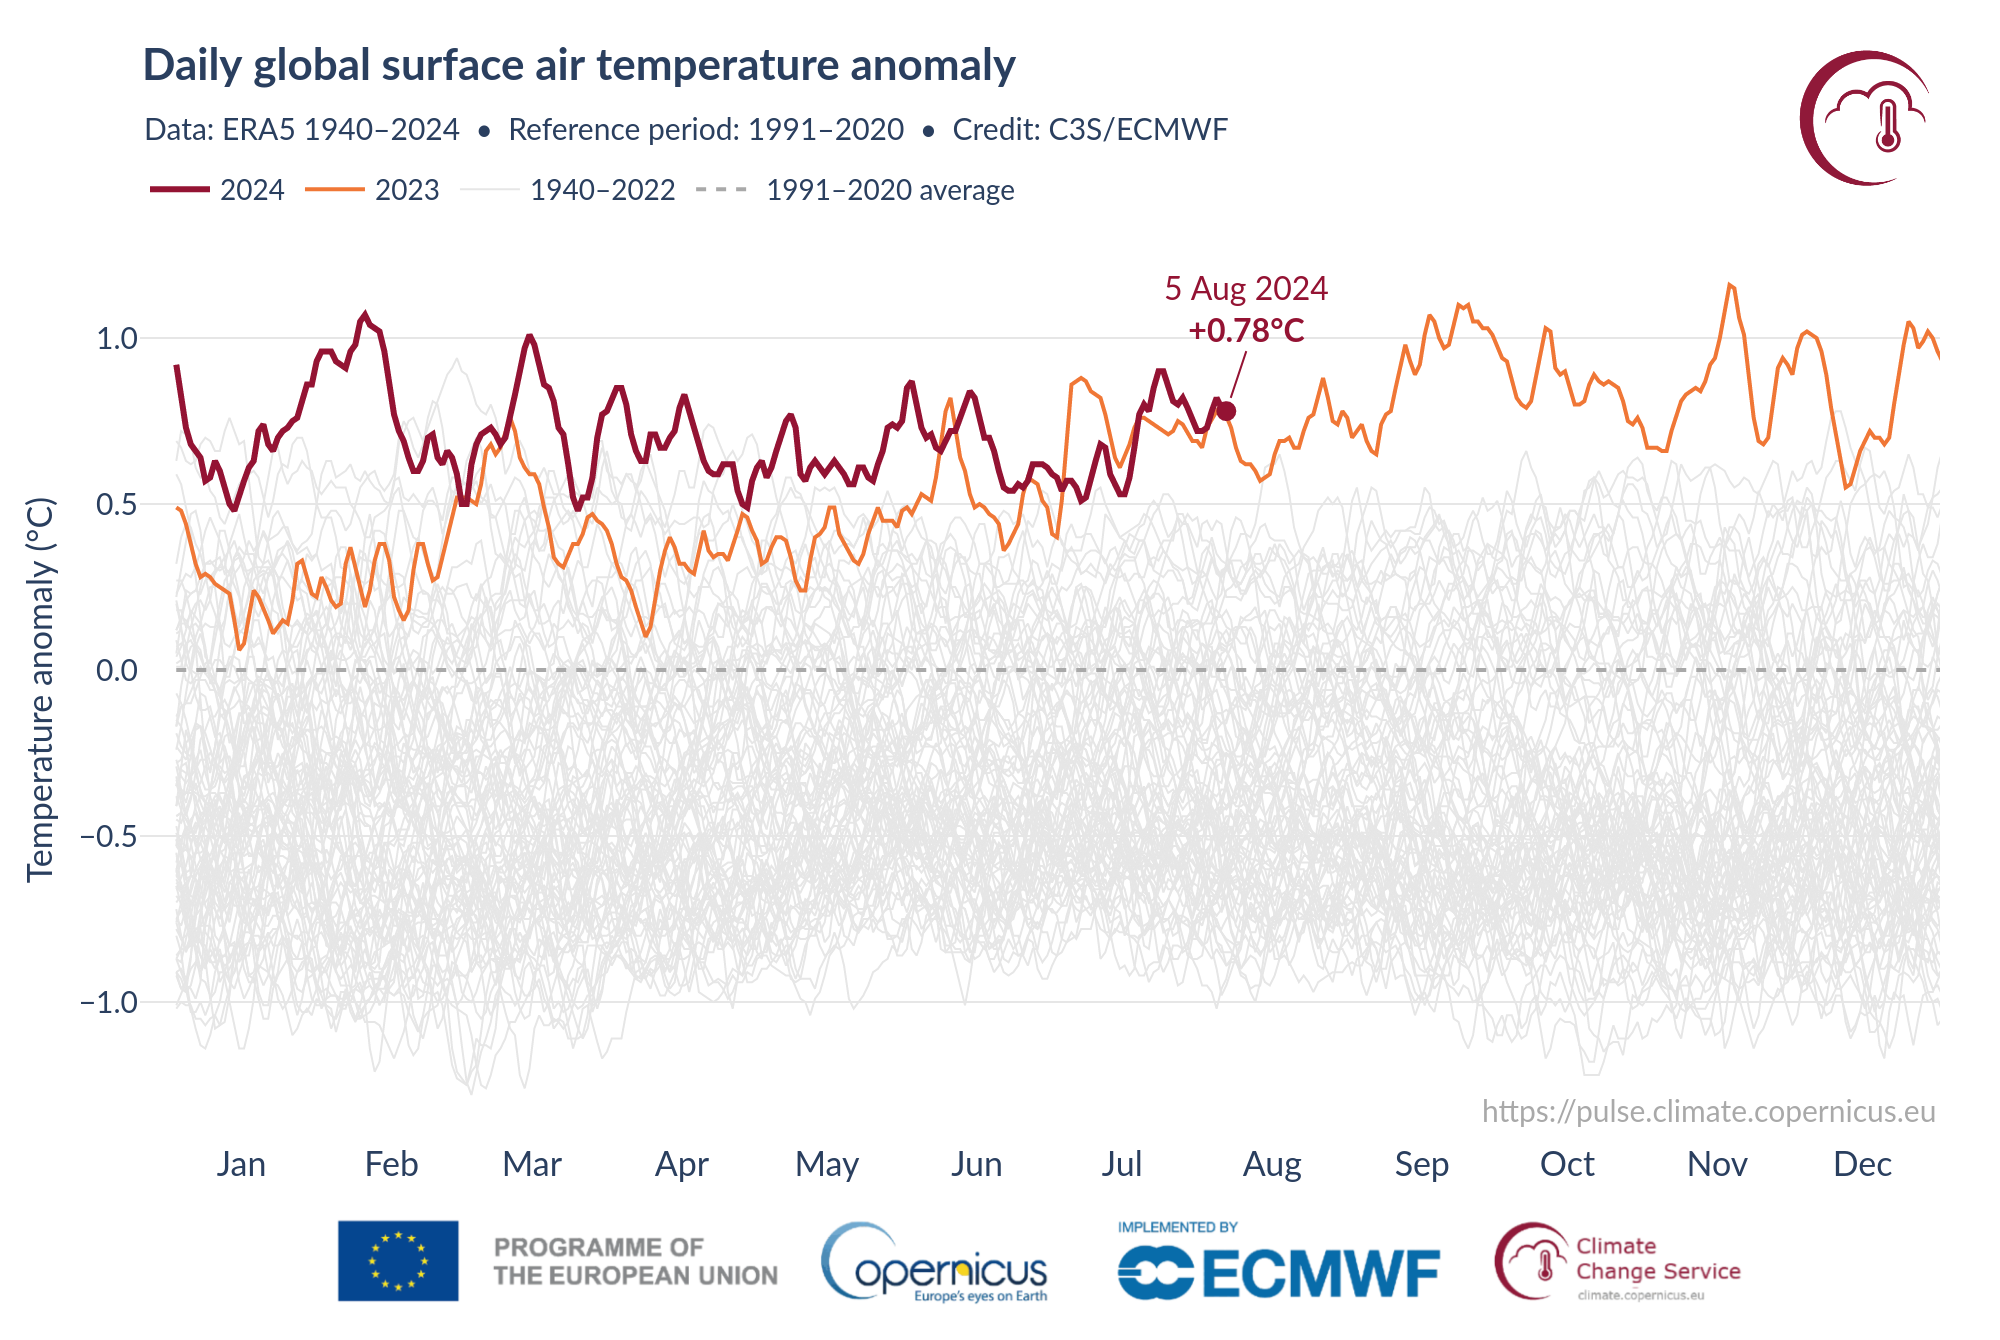
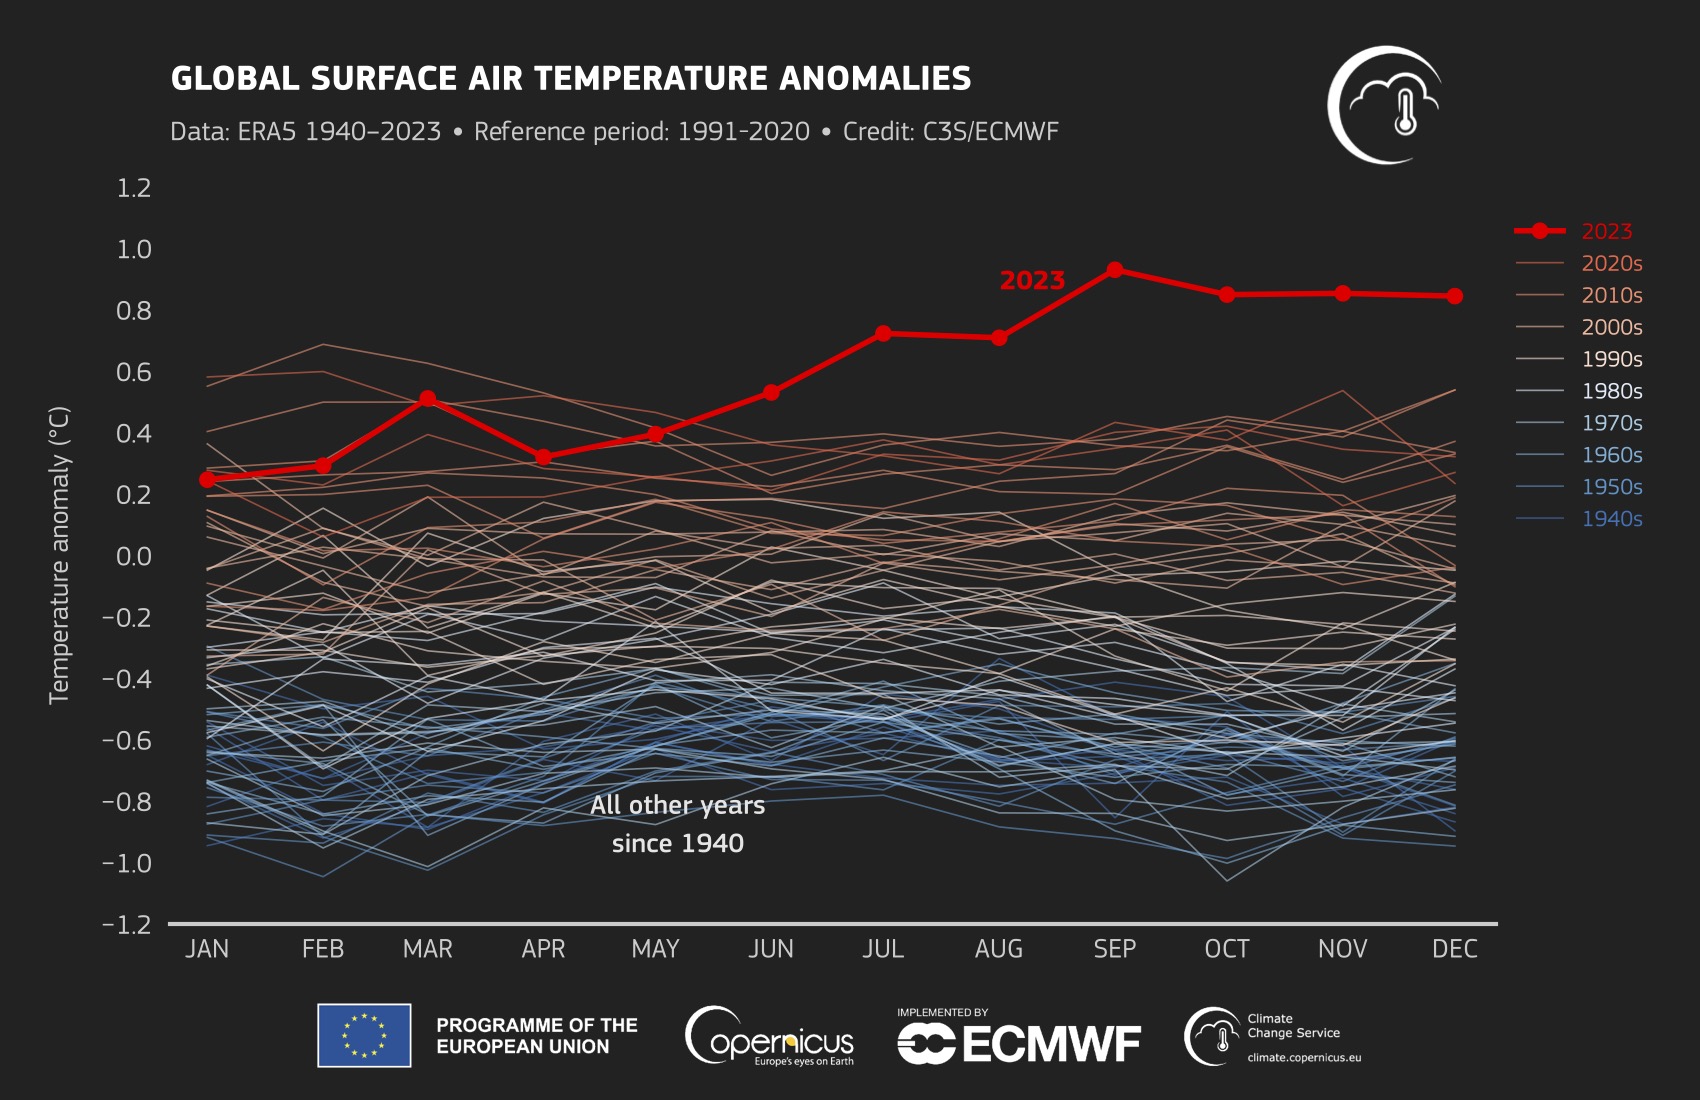
With very few and very small exceptions, 2024 was unusually hot across the globe. Credit: Copernicus
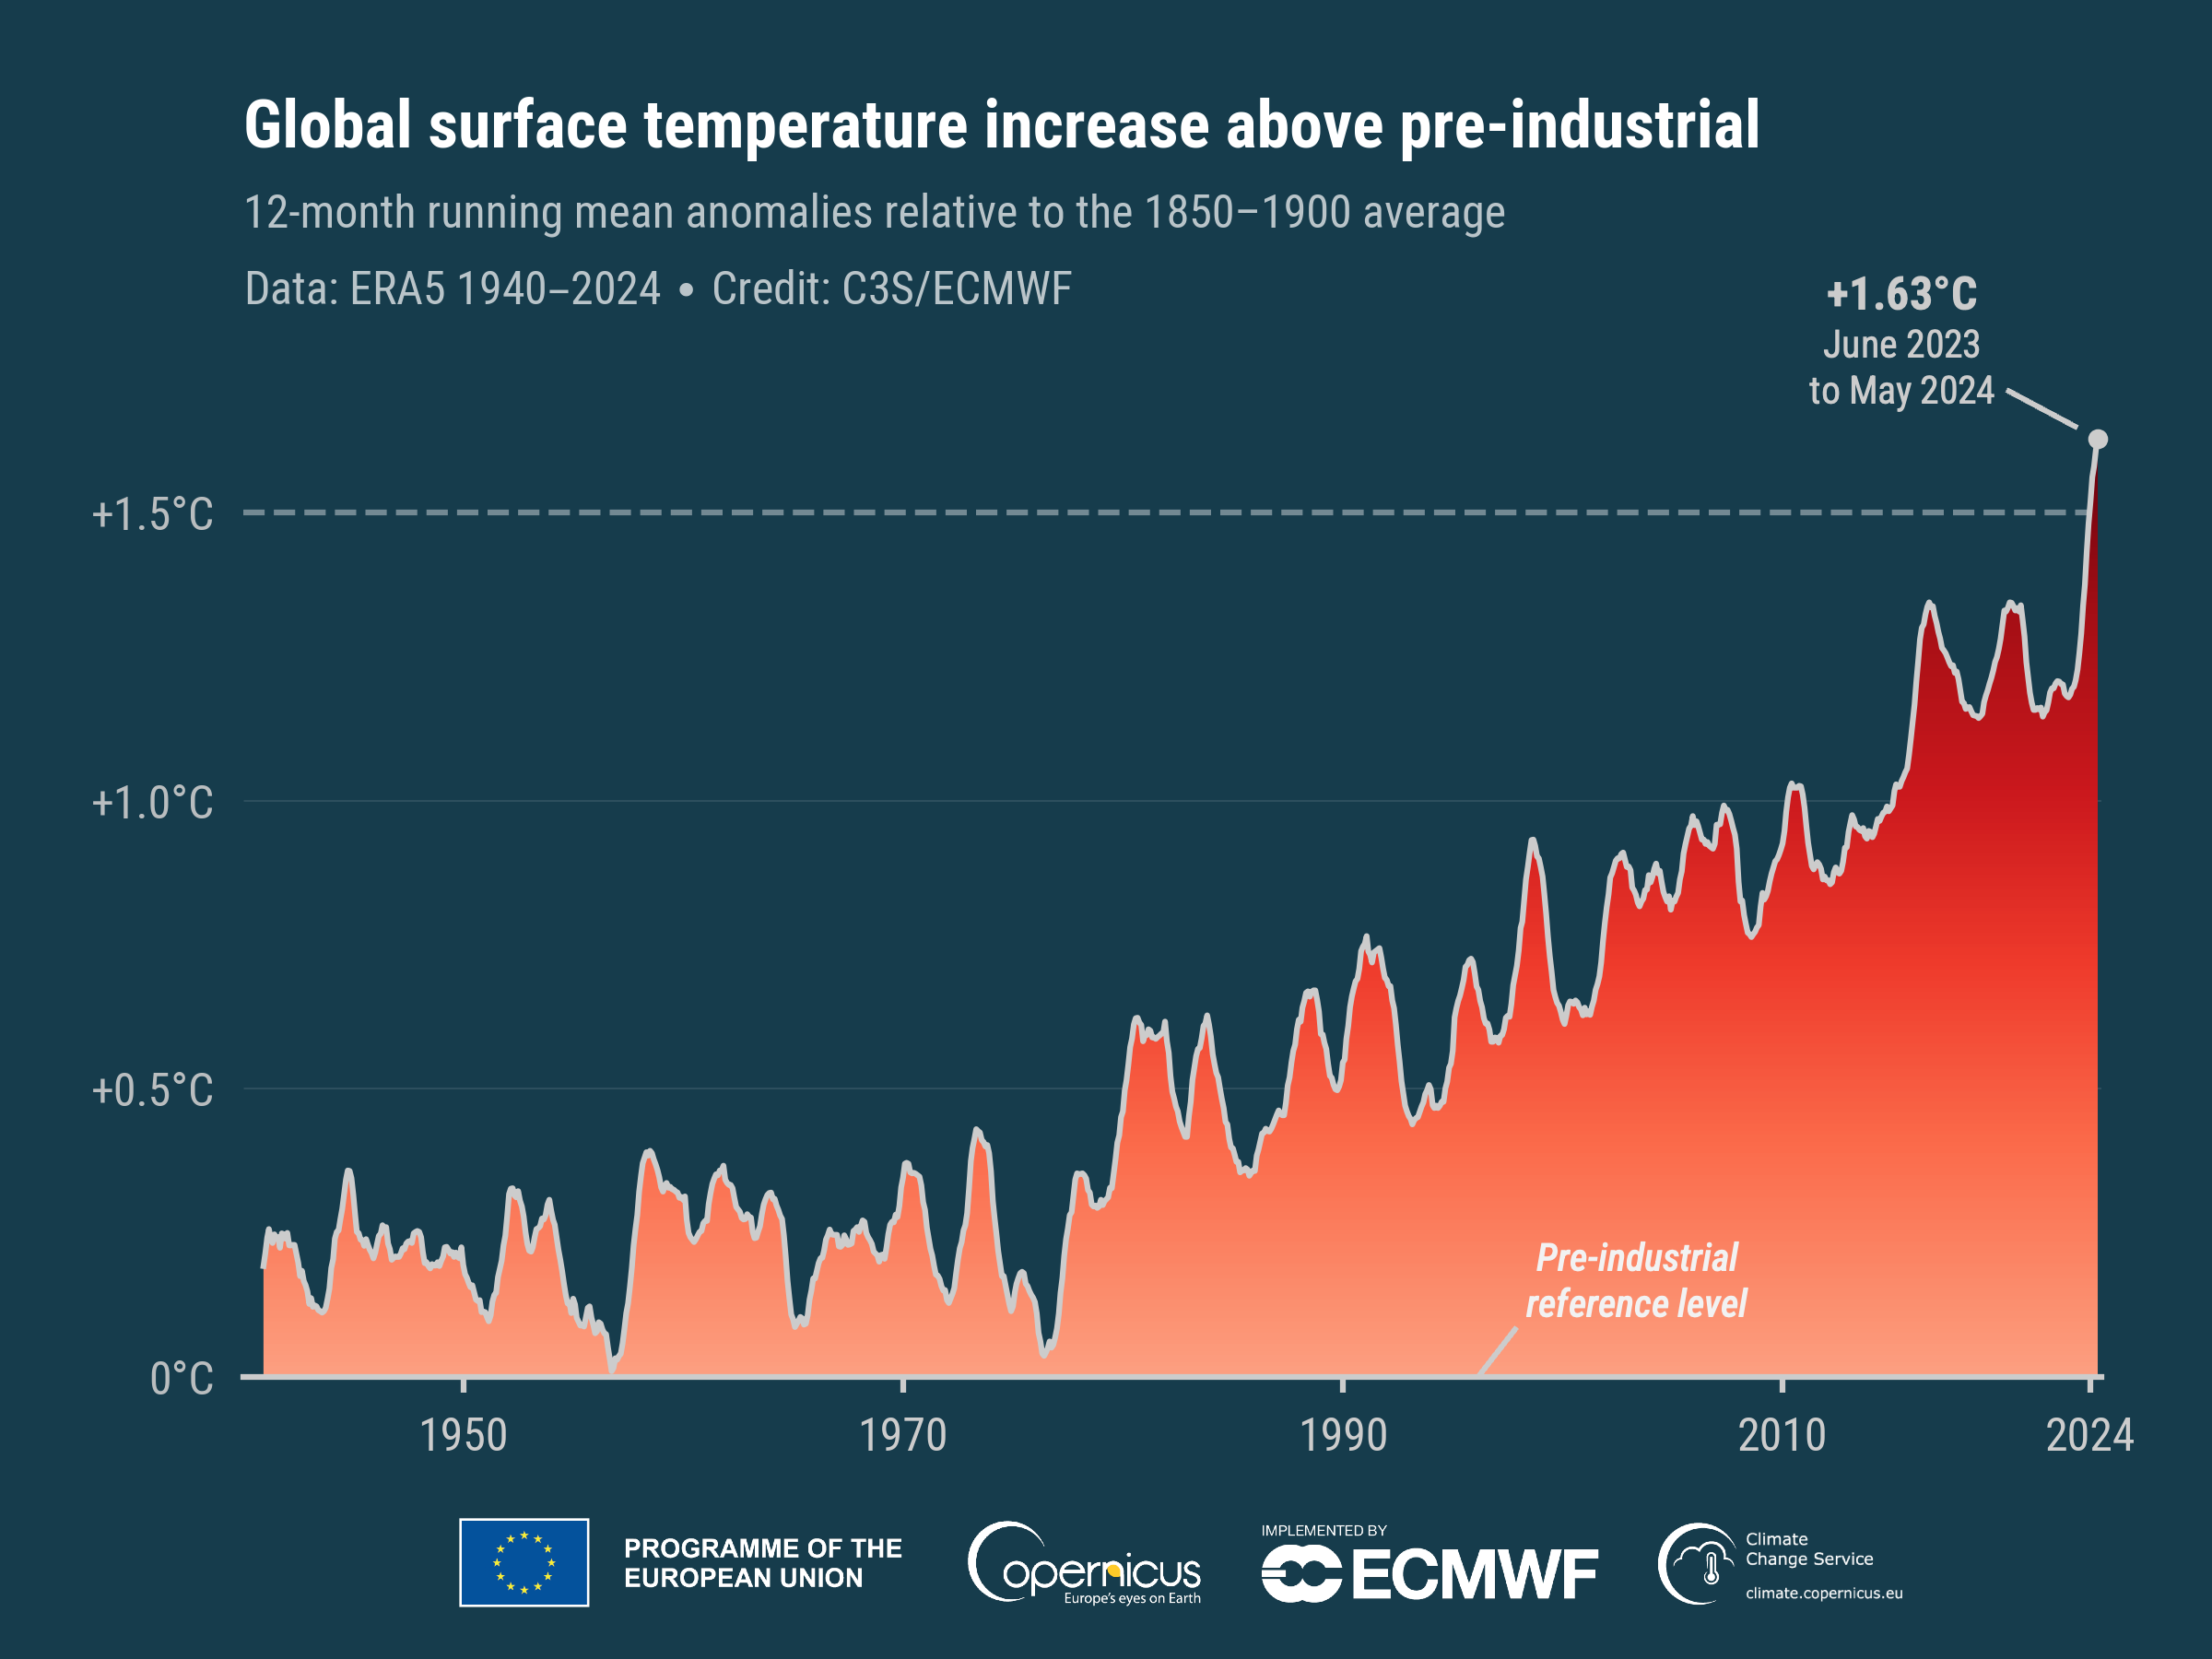
Over the last 24 hours or so, the major organizations that keep track of global temperatures have released figures for 2024, and all of them agree: 2024 was the warmest year yet recorded, joining 2023 as an unusual outlier in terms of how rapidly things heated up. At least two of the organizations, the European Union’s Copernicus and Berkeley Earth, place the year at about 1.6° C above pre-industrial temperatures, marking the first time that the Paris Agreement goal of limiting warming to 1.5° has been exceeded.
NASA and the National Oceanic and Atmospheric Administration both place the mark at slightly below 1.5° C over pre-industrial temperatures (as defined by the 1850–1900 average). However, that difference largely reflects the uncertainties in measuring temperatures during that period rather than disagreement over 2024.
It’s hot everywhere
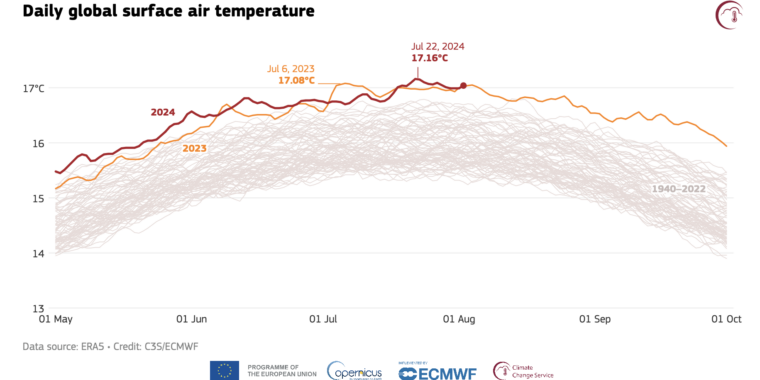
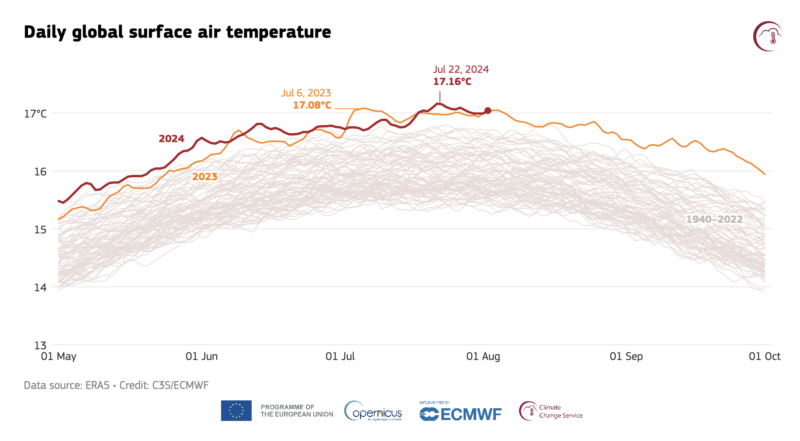
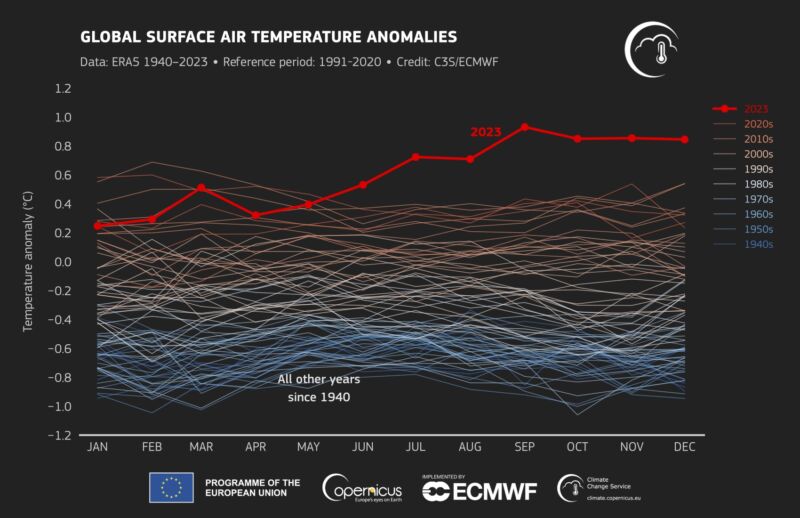
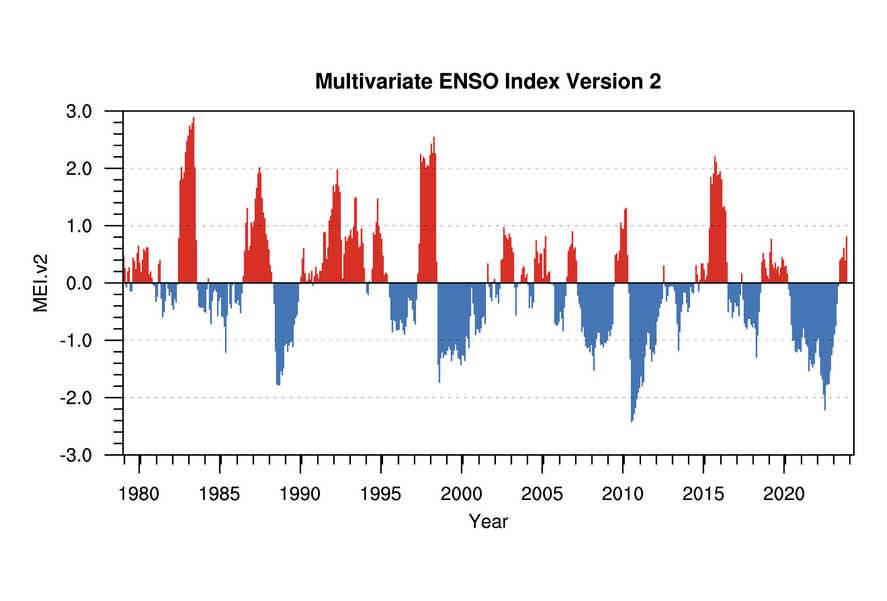
2023 had set a temperature record largely due to a switch to El Niño conditions midway through the year, which made the second half of the year exceptionally hot. It takes some time for that heat to make its way from the ocean into the atmosphere, so the streak of warm months continued into 2024, even as the Pacific switched into its cooler La Niña mode.
While El Niños are regular events, this one had an outsized impact because it was accompanied by unusually warm temperatures outside the Pacific, including record high temperatures in the Atlantic and unusual warmth in the Indian Ocean. Land temperatures reflect this widespread warmth, with elevated temperatures on all continents. Berkeley Earth estimates that 104 countries registered 2024 as the warmest on record, meaning 3.3 billion people felt the hottest average temperatures they had ever experienced.
Different organizations use slightly different methods to calculate the global temperature and have different baselines. For example, Copernicus puts 2024 at 0.72° C above a baseline that will be familiar to many people since they were alive for it: 1991 to 2000. In contrast, NASA and NOAA use a baseline that covers the entirety of the last century, which is substantially cooler overall. Relative to that baseline, 2024 is 1.29° C warmer.
Lining up the baselines shows that these different services largely agree with each other, with most of the differences due to uncertainties in the measurements, with the rest accounted for by slightly different methods of handling things like areas with sparse data.
Describing the details of 2024, however, doesn’t really capture just how exceptional the warmth of the last two years has been. Starting in around 1970, there’s been a roughly linear increase in temperature driven by greenhouse gas emissions, despite many individual years that were warmer or cooler than the trend. The last two years have been extreme outliers from this trend. The last time there was a single comparable year to 2024 was back in the 1940s. The last time there were two consecutive years like this was in 1878.
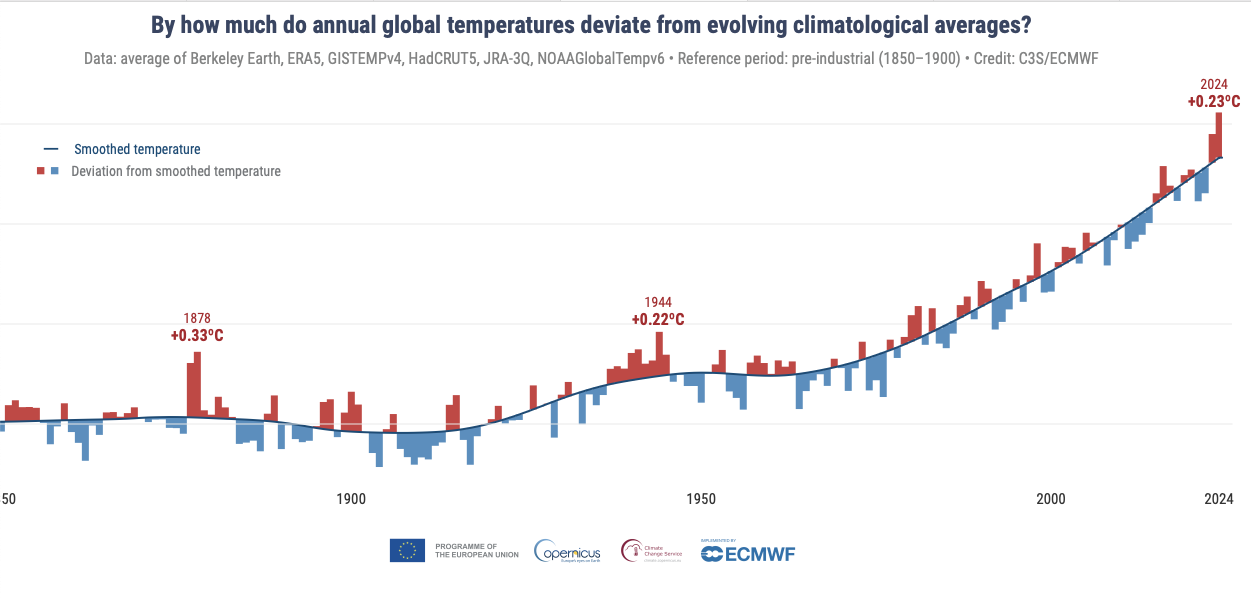
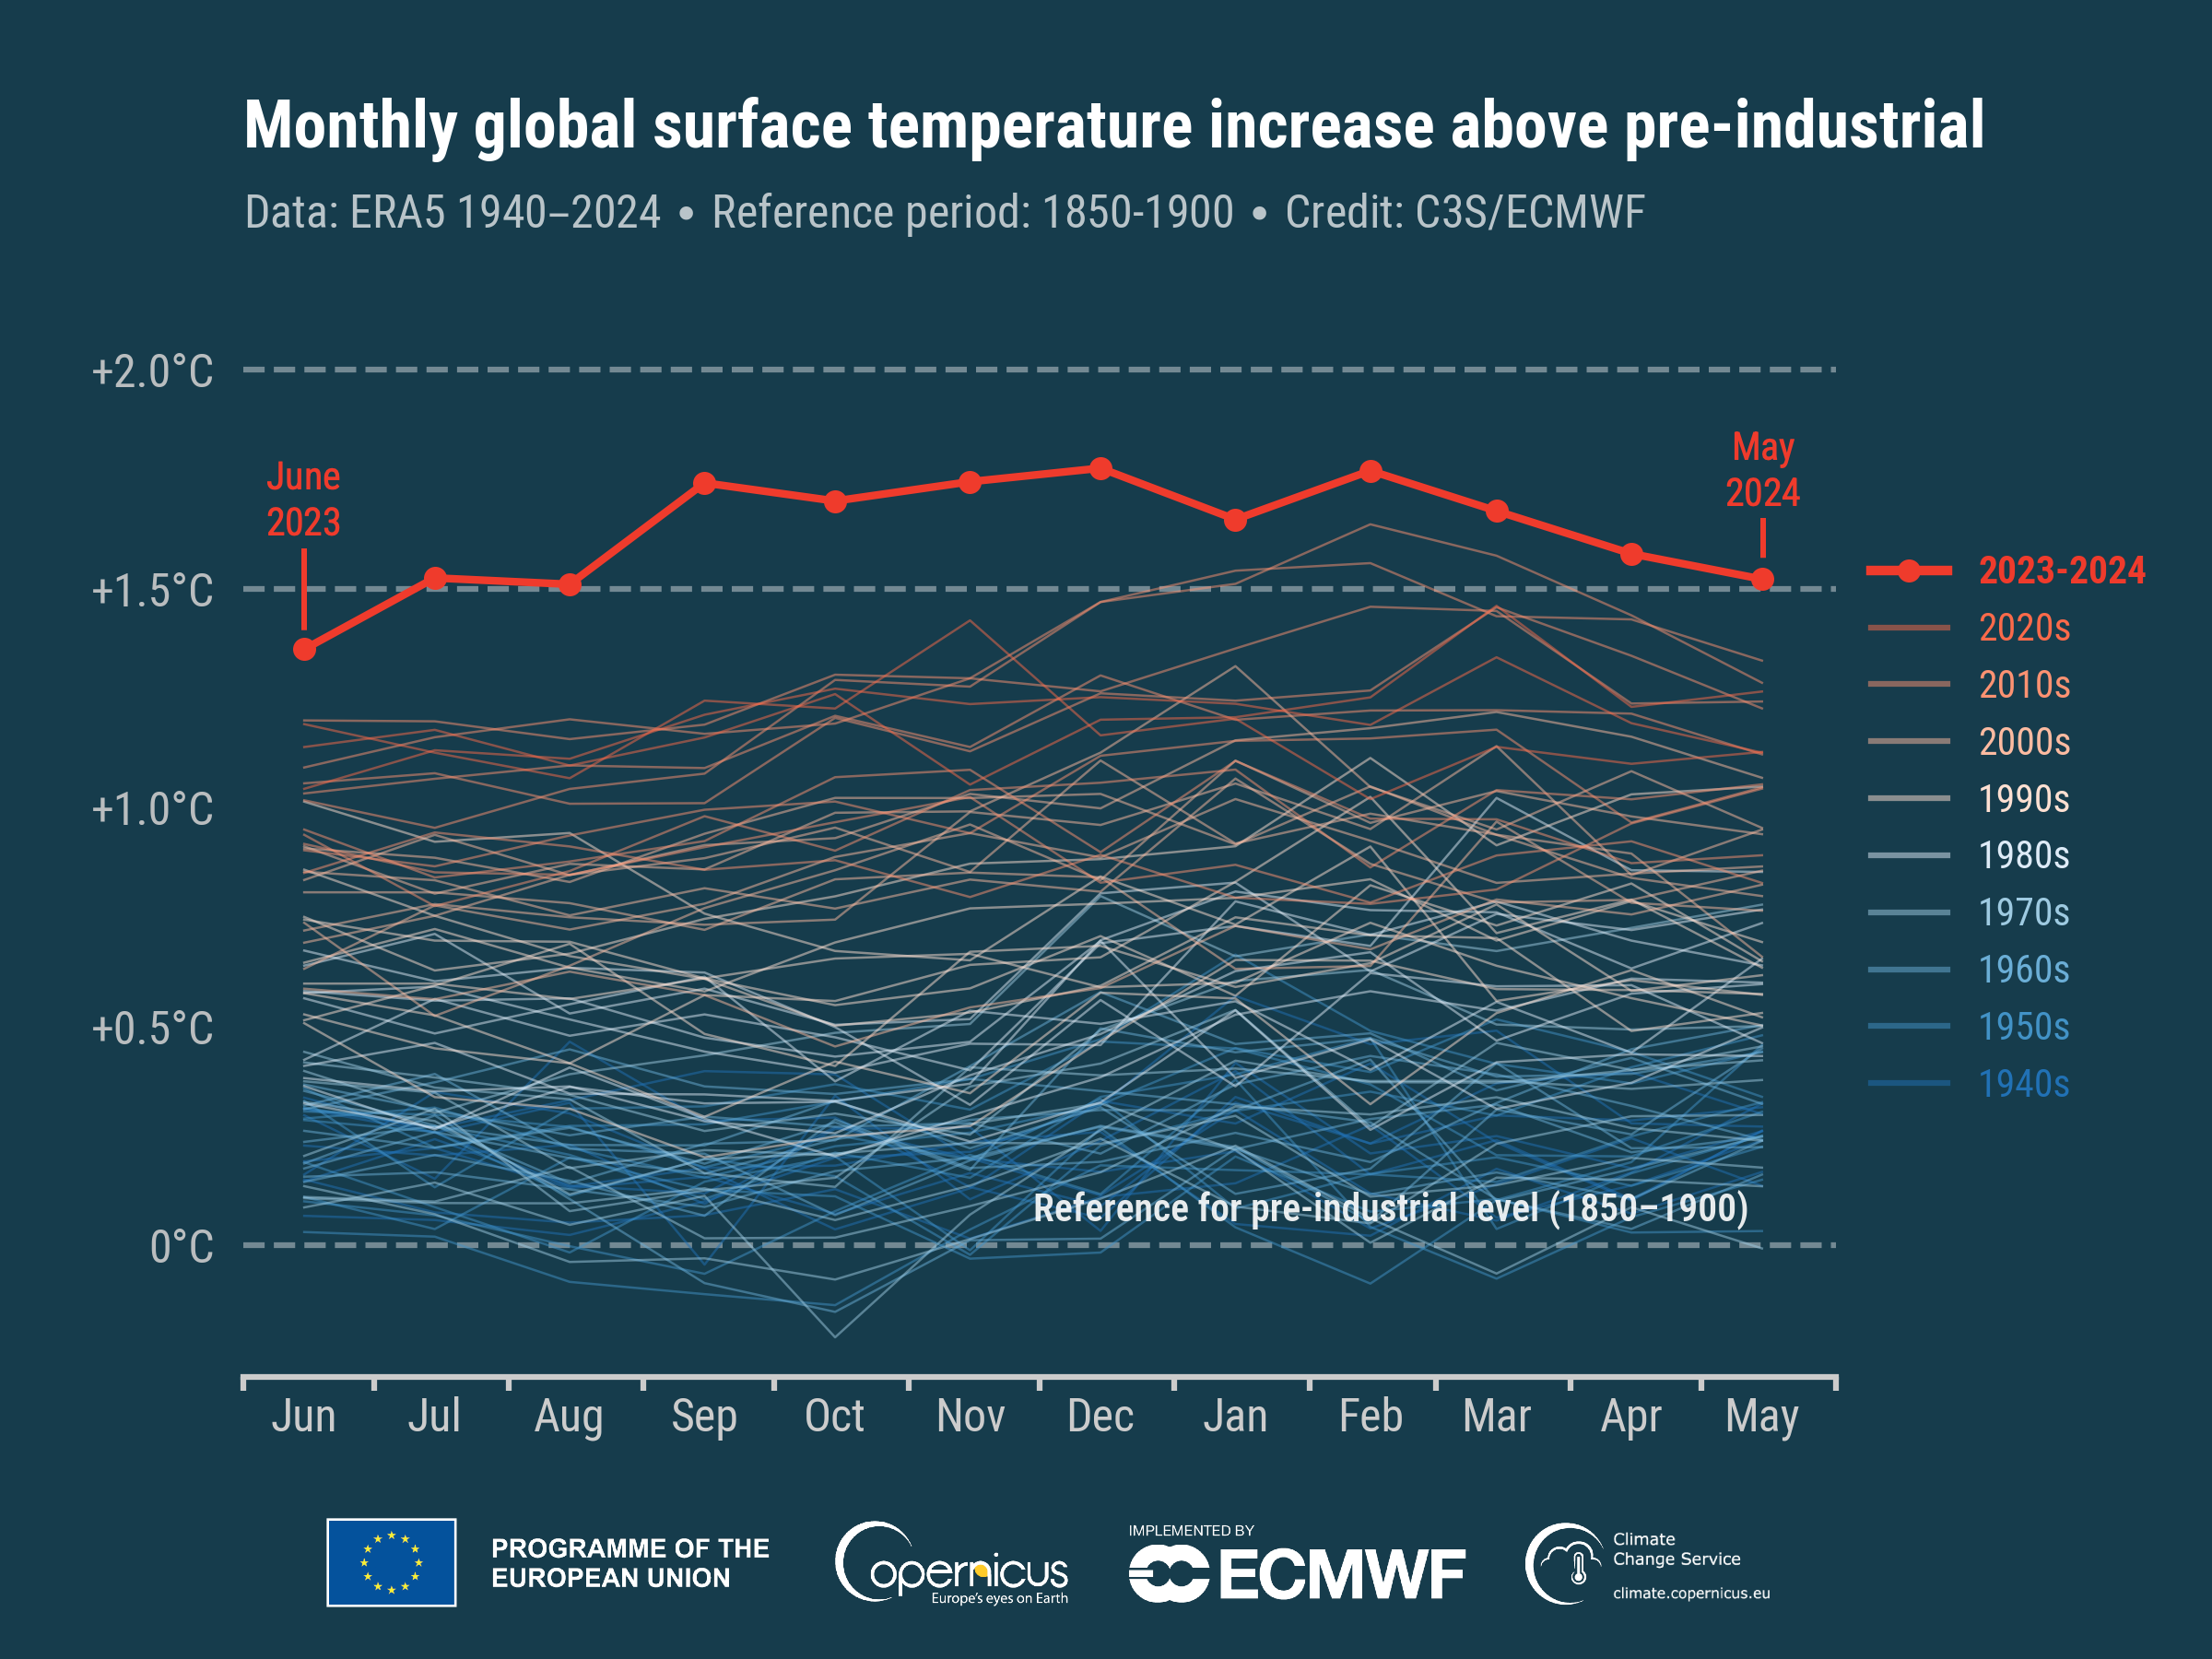
Relative to the five-year temperature average, 2024 is an exceptionally large excursion. Credit: Copernicus
“These were during the ‘Great Drought’ of 1875 to 1878, when it is estimated that around 50 million people died in India, China, and parts of Africa and South America,” the EU’s Copernicus service notes. Despite many climate-driven disasters, the world at least avoided a similar experience in 2023-24.
Berkeley Earth provides a slightly different way of looking at it, comparing each year since 1970 with the amount of warming we’d expect from the cumulative greenhouse gas emissions.

Relative to the expected warming from greenhouse gasses, 2024 represents a large departure. Credit: Berkeley Earth
These show that, given year-to-year variations in the climate system, warming has closely tracked expectations over five decades. 2023 and 2024 mark a dramatic departure from that track, although it comes at the end of a decade where most years were above the trend line. Berkeley Earth estimates that there’s just a 1 in 100 chance of that occurring due to the climate’s internal variability.
Is this a new trend?
The big question is whether 2024 is an exception and we should expect things to fall back to the trend that’s dominated since the 1970s, or it marks a departure from the climate’s recent behavior. And that’s something we don’t have a great answer to.
If you take away the influence of recent greenhouse gas emissions and El Niño, you can focus on other potential factors. These include a slight increase expected due to the solar cycle approaching its maximum activity. But, beyond that, most of the other factors are uncertain. The Hunga Tonga eruption put lots of water vapor into the stratosphere, but the estimated effects range from slight warming to cooling equivalent to a strong La Niña. Reductions in pollution from shipping are expected to contribute to warming, but the amount is debated.
There is evidence that a decrease in cloud cover has allowed more sunlight to be absorbed by the Earth, contributing to the planet’s warming. But clouds are typically a response to other factors that influence the climate, such as the amount of water vapor in the atmosphere and the aerosols present to seed water droplets.
It’s possible that a factor that we missed is driving the changes in cloud cover or that 2024 just saw the chaotic nature of the atmosphere result in less cloud cover. Alternatively, we may have crossed a warming tipping point, where the warmth of the atmosphere makes cloud formation less likely. Knowing that will be critical going forward, but we simply don’t have a good answer right now.
Climate goals
There’s an equally unsatisfying answer to what this means for our chance of hitting climate goals. The stretch goal of the Paris Agreement is to limit warming to 1.5° C, because it leads to significantly less severe impacts than the primary, 2.0° target. That’s relative to pre-industrial temperatures, which are defined using the 1850–1900 period, the earliest time where temperature records allow a reconstruction of the global temperature.
Unfortunately, all the organizations that handle global temperatures have some differences in the analysis methods and data used. Given recent data, these differences result in very small divergences in the estimated global temperatures. But with the far larger uncertainties in the 1850–1900 data, they tend to diverge more dramatically. As a result, each organization has a different baseline, and different anomalies relative to that.
As a result, Berkeley Earth registers 2024 as being 1.62° C above preindustrial temperatures, and Copernicus 1.60° C. In contrast, NASA and NOAA place it just under 1.5° C (1.47° and 1.46°, respectively). NASA’s Gavin Schmidt said this is “almost entirely due to the [sea surface temperature] data set being used” in constructing the temperature record.
There is, however, consensus that this isn’t especially meaningful on its own. There’s a good chance that temperatures will drop below the 1.5° mark on all the data sets within the next few years. We’ll want to see temperatures consistently exceed that mark for over a decade before we consider that we’ve passed the milestone.
That said, given that carbon emissions have barely budged in recent years, there’s little doubt that we will eventually end up clearly passing that limit (Berkeley Earth is essentially treating it as exceeded already). But there’s widespread agreement that each increment between 1.5° and 2.0° will likely increase the consequences of climate change, and any continuing emissions will make it harder to bring things back under that target in the future through methods like carbon capture and storage.
So, while we may have committed ourselves to exceed one of our major climate targets, that shouldn’t be viewed as a reason to stop trying to limit greenhouse gas emissions.

John is Ars Technica’s science editor. He has a Bachelor of Arts in Biochemistry from Columbia University, and a Ph.D. in Molecular and Cell Biology from the University of California, Berkeley. When physically separated from his keyboard, he tends to seek out a bicycle, or a scenic location for communing with his hiking boots.
Everyone agrees: 2024 the hottest year since the thermometer was invented Read More »

