Sadly, the US is unlikely to get the Econeer trim, which uses a seat fabric made entirely from recycled PET bottles (instead, we should be getting an eco vinyl option).
Of course, you need to do more than just pick better materials, some of which have been recycled, if you want to seriously dent the carbon footprint of your new vehicle. That’s especially true if it’s electric—for all an EV’s benefits, they remain significantly more energy-intensive to build than a new internal combustion engine vehicle. And automakers do need to make serious dents in their carbon footprints: BMW has to slash its carbon emissions from a 2019 level of 150 million tons down to 109 million tons in 2030. For 2024, it was down to 135 million tons, the company told us.
Fishing nets are turned into plastic granules, then used to make bits of the car.
The Neue Klasse is essential to meeting that goal. The factory in Debrecen, Hungary, is powered entirely by renewable energy, including an entirely electric paint shop, and it generates two-thirds the amount of CO2 as one of BMW’s established factories. And the battery pack, which uses an all-new BMW cylindrical cell, has a 42 percent smaller carbon footprint per kWh than the prismatic cells used in BMW’s current 5th-generation EVs.
We can’t say much about the expected efficiency of the new 6th-gen powertrain until later this month, but we can say that BMW calculates that the iX3 can reach its break-even point with an ICE vehicle within just a year. Charge the car with entirely renewable electricity, and within just 10,900 miles (17,500 km), it’s on par with an ICE vehicle; using the normal European energy generation mix, that crossover comes at a little more than 13,300 miles (21,000 km).
At 124,000 miles (200,000 km), the iX3 should have a lifetime carbon footprint of 23 tons (or 14.6 tons exclusively using renewable energy); by contrast, a conventionally powered BMW X3 crossover would have a footprint of 52.8 tons.
Check back on August 25, when we can tell you what else we learned about BMW’s next EV crossover.
The UK has transitioned to a lower-emission grid. Now comes the hard part.
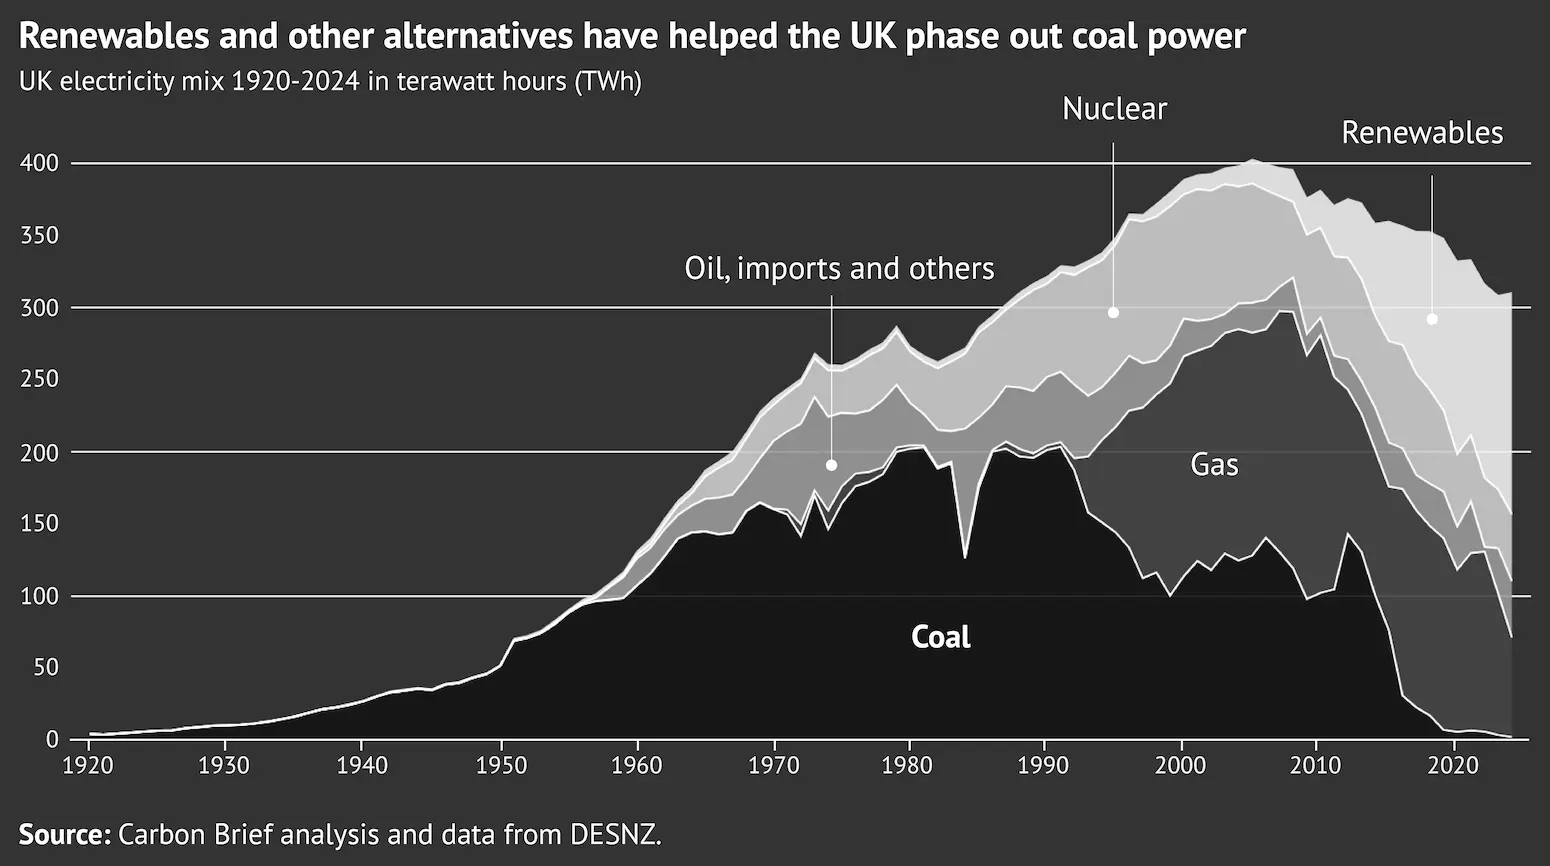
With the closure of its last coal-fired power plant, Ratcliffe-on-Soar, on September 30, 2024, the United Kingdom has taken a significant step toward its net-zero goals. It’s no small feat to end the 142-year era of coal-powered electricity in the country that pioneered the Industrial Revolution. Yet the UK’s journey away from coal has been remarkably swift, with coal generation plummeting from 40 percent of the electricity mix in 2012 to just two percent in 2019, and finally to zero in 2024.
As of 2023, approximately half of UK electricity generation comes from zero-carbon sources, with natural gas serving as a transitional fuel. The UK aims to cut greenhouse gas emissions by 42 percent to 48 percent by 2027 and achieve net-zero by 2050. The government set a firm target to generate all of its electricity from renewable sources by 2040, emphasizing offshore wind and solar energy as the keys.
What will things look like in the intervening years, which will lead us from today to net-zero? Everyone’s scenario, even when based in serious science, boils down to a guessing game. Yet some things are more certain than others, the most important of these factors being the ones that are on solid footing beneath all of the guesswork.
Long-term goals
The closure of all UK coal-fired power stations in 2024 marked a crucial milestone in the nation’s decarbonization efforts. Coal was once the dominant source of electricity generation, but its contribution to greenhouse gas emissions made it a primary target for phase-out. The closure of these facilities has significantly reduced the UK’s carbon footprint and paved the way for cleaner energy sources.
With transition from coal, natural gas is set to play a crucial role as a “transition fuel.” The government’s “British Energy Security Strategy” argued that gas must continue to be an important part of the energy mix. It positioned gas as the “glue” that holds the electricity system together during the transition. Even the new Starmer government recognizes that, as the country progresses towards net-zero by 2050, the country may still use about a quarter of the gas it currently consumes.
Natural gas emits approximately half as much carbon dioxide as coal when combusted, making it a cleaner alternative during the shift to renewable energy sources. In 2022, natural gas accounted for around 40 percent of the UK’s electricity generation, while coal contributed less than two percent. This transition phase is deemed by the government to be essential as the country ramps up the capacity of renewable energy sources, particularly wind and solar power, to fill gaps left by the reduction of fossil fuels. The government aims to phase out natural gas that’s not coupled with carbon capture by 2035, but in the interim, it serves as a crucial bridge, ensuring energy security while reducing overall emissions.
But its role is definitely intended to be temporary; the UK’s long-term energy goal is to reduce reliance on all fossil fuels (starting with imported supplies), pushing for a rapid transition to cleaner, domestic sources of energy.
The government’s program has five primary targets:
Fully decarbonizing the power system (2035)
Ending the sale of new petrol and diesel cars (2035)
Achieving “Jet Zero” – net-zero UK aviation emissions (2050)
Creating 30,000 hectares of new woodland per year (2025)
Generating 50 percent of its total electricity from renewable sources by 2030
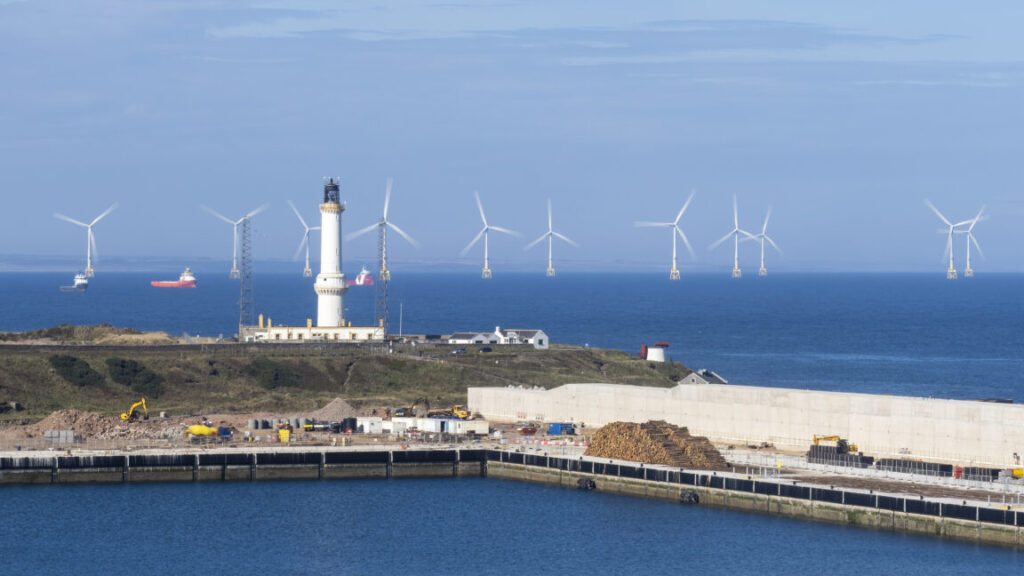
Offshore wind energy has emerged as this strategy’s key component, with significant investments being made in new wind farms. Favorable North Sea wind conditions have immense potential. In recent years, a surge in offshore wind investment has translated into several large-scale developments in advanced planning stages or now under construction.
The government has set a target to increase offshore wind capacity to 50 GW by 2030, up from around 10 GW currently. This initiative is supported by substantial financial commitments from both the public and private sectors. Recent investment announcements underscore the UK’s commitment to this goal and the North Sea’s central role in it. In 2023, the government announced plans to invest $25 billion (20 billion British pounds) in carbon capture and offshore wind projects in the North Sea over the next two decades. This investment is expected to create up to 50,000 jobs and help position the UK as a leader in clean energy technologies.
This was part of investments totaling over $166 million (133 million pounds) to support the development of new offshore wind farms, which are expected to create thousands of jobs and stimulate local economies.
In 2024, further investments were announced to support the expansion of offshore wind capacity. The government committed to holding annual auctions for new offshore wind projects to meet its goal of quadrupling offshore wind capacity by 2030. These investments are part of a broader strategy to leverage the UK’s expertise in offshore industries and transition the North Sea from an oil and gas hub to a clean-energy powerhouse.
Offshore wind
As the UK progresses toward its net-zero target, it faces both challenges and opportunities. While significant progress has been made in decarbonizing the power sector, the national government’s Climate Change Committee has noted that emissions reductions need to accelerate in other sectors, particularly agriculture, land use, and waste. However, with continued investment in renewable energy and supportive policies, the UK is positioning itself to become a leader in the global transition to a low-carbon economy.
Looking ahead, 2025 promises to be a landmark year for the UK’s green energy sector, with further investment announcements and projects in the pipeline.
The Crown Estate, which manages the seabed around England, Wales, and Northern Ireland, has made significant strides in facilitating new leases for offshore wind development. In 2023, the Crown Estate Scotland announced the successful auction of seabed leases for new offshore wind projects, totaling a capacity of 5 gigawatts. And in 2024, the government plans to hold its next major leasing round, which could see the deployment of an additional 7 GW of offshore wind capacity.
The UK government also approved plans for the Dogger Bank Wind Farm, which will be the world’s largest offshore wind farm when completed. Located off the coast of Yorkshire, this massive project will ultimately generate enough electricity to power millions of homes. Dogger is a joint venture linking SSE Renewables, Equinor, and Vattenfall.
This is in line with the government’s broader strategy to enhance energy independence and resilience, particularly in light of the geopolitical uncertainties affecting global energy markets. The UK’s commitment to renewable energy is not merely an environmental imperative; it is also an economic opportunity. By harnessing the vast potential of the North Sea, the UK aims not only to meet its net-zero targets but also to drive economic growth and job creation in the green energy sector, ensuring a sustainable future for generations to come.
Recognizing wind’s importance, the UK government launched a 2024 consultation on plans to develop a new floating wind energy sector.
The transition to a greener economy is projected to create up to 400,000 jobs by 2030 across various sectors, including manufacturing, installation, and maintenance of renewable energy technologies.
Its growing offshore wind industry is expected to attract billions in investment, solidifying the UK’s position as a leader in the global green energy market. The government’s commitment to offshore wind development, underscored by substantial investments in 2023 and anticipated announcements for 2024, signals a robust path forward.
Moving away from gas
Still, the path ahead remains challenging, requiring a multifaceted approach that balances economic growth, energy security, and environmental sustainability.
With the transition from coal, natural gas is now poised to play the central role as a bridge fuel. While natural gas emits fewer greenhouse gases than coal, it is still a fossil fuel and contributes to carbon emissions. However, in the short term, natural gas can help maintain energy security and provide a reliable source of electricity during periods of low renewable energy output. Additionally, natural gas can be used to produce hydrogen, potentially coupled with carbon capture, enabling a clean energy carrier that can be integrated into the existing energy infrastructure.
To support the country’s core clean energy goals, the government is implementing specific initiatives, although the pace has been quite uneven. The UK Emissions Trading Scheme (ETS) is being strengthened to incentivize industrial decarbonization. The government has also committed to investing in key green industries alongside offshore wind: carbon capture, usage and storage (CCUS), and nuclear energy.
Combined, these should allow the UK to limit its use of natural gas and capture the emissions associated with any remaining fossil fuel use.
While both countries are relying heavily on wind power, the UK’s energy-generation transformations are different from Germany’s. While both governments push to make some progress on the path to net-zero carbon emissions, their approaches and timelines differ markedly.
Energiewende, Germany’s energy transition, is characterized by what some critics consider to be overly ambitious goals for achieving net greenhouse gas neutrality by 2045. Those critics think that the words don’t come close to matching the required levels of either government or private sector financial commitment. Together with the Bundestag, the chancellor has set interim targets to reduce emissions by 65 percent by 2030 and 88 percent by 2040 (both compared to 1990 levels). Germany’s energy mix is heavily reliant on renewables, with a goal of sourcing 80 percent of its electricity from renewable energy by 2030—and achieving 100 percent by 2035.
However, Germany has faced challenges due to continued reliance on coal and natural gas, which made it difficult to reach its emissions goals.
The UK, however, appears to be ahead in terms of immediate reductions in coal use and the integration of renewables into its energy mix. Germany’s path is more complex, as it balances its energy transition with energy security concerns, particularly in light of how Russia’s war affects gas supplies.
Set to be killed by Trump, the rules mostly lock in existing trends.
In April last year, the Environmental Protection Agency released its latest attempt to regulate the carbon emissions of power plants under the Clean Air Act. It’s something the EPA has been required to do since a 2007 Supreme Court decision that settled a case that started during the Clinton administration. The latest effort seemed like the most aggressive yet, forcing coal plants to retire or install carbon capture equipment and making it difficult for some natural gas plants to operate without capturing carbon or burning green hydrogen.
Yet, according to a new analysis published in Thursday’s edition of Science, they wouldn’t likely have a dramatic effect on the US’s future emissions even if they were to survive a court challenge. Instead, the analysis suggests the rules serve more like a backstop to prevent other policy changes and increased demand from countering the progress that would otherwise be made. This is just as well, given that the rules are inevitably going to be eliminated by the incoming Trump administration.
A long time coming
The net result of a number of Supreme Court decisions is that greenhouse gasses are pollutants under the Clean Air Act, and the EPA needed to determine whether they posed a threat to people. George W. Bush’s EPA dutifully performed that analysis but sat on the results until its second term ended, leaving it to the Obama administration to reach the same conclusion. The EPA went on to formulate rules for limiting carbon emissions on a state-by-state basis, but these were rapidly made irrelevant because renewable power and natural gas began displacing coal even without the EPA’s encouragement.
Nevertheless, the Trump administration replaced those rules with ones designed to accomplish even less, which were thrown out by a court just before Biden’s inauguration. Meanwhile, the Supreme Court stepped in to rule on the now-even-more-irrelevant Obama rules, determining that the EPA could only regulate carbon emissions at the level of individual power plants rather than at the level of the grid.
All of that set the stage for the latest EPA rules, which were formulated by the Biden administration’s EPA. Forced by the court to regulate individual power plants, the EPA allowed coal plants that were set to retire within the decade to continue to operate as they have. Anything that would remain operational longer would need to either switch fuels or install carbon capture equipment. Similarly, natural gas plants were regulated based on how frequently they were operational; those that ran less than 40 percent of the time could face significant new regulations. More than that, and they’d have to capture carbon or burn a fuel mixture that is primarily hydrogen produced without carbon emissions.
While the Biden EPA’s rules are currently making their way through the courts, they’re sure to be pulled in short order by the incoming Trump administration, making the court case moot. Nevertheless, people had started to analyze their potential impact before it was clear there would be an incoming Trump administration. And the analysis is valuable in the sense that it will highlight what will be lost when the rules are eliminated.
By some measures, the answer is not all that much. But the answer is also very dependent upon whether the Trump administration engages in an all-out assault on renewable energy.
Regulatory impact
The work relies on the fact that various researchers and organizations have developed models to explore how the US electric grid can economically meet demand under different conditions, including different regulatory environments. The researchers obtained nine of them and ran them with and without the EPA’s proposed rules to determine their impact.
On its own, eliminating the rules has a relatively minor impact. Without the rules, the US grid’s 2040 carbon dioxide emissions would end up between 60 and 85 percent lower than they were in 2005. With the rules, the range shifts to between 75 and 85 percent—in essence, the rules reduce the uncertainty about the outcomes that involve the least change.
That’s primarily because of how they’re structured. Mostly, they target coal plants, as these account for nearly half of the US grid’s emissions despite supplying only about 15 percent of its power. They’ve already been closing at a rapid clip, and would likely continue to do so even without the EPA’s encouragement.
Natural gas plants, the other major source of carbon emissions, would primarily respond to the new rules by operating less than 40 percent of the time, thus avoiding stringent regulation while still allowing them to handle periods where renewable power underproduces. And we now have a sufficiently large fleet of natural gas plants that demand can be met without a major increase in construction, even with most plants operating at just 40 percent of their rated capacity. The continued growth of renewables and storage also contributes to making this possible.
One irony of the response seen in the models is that it suggests that two key pieces of the Inflation Reduction Act (IRA) are largely irrelevant. The IRA provides benefits for the deployment of carbon capture and the production of green hydrogen (meaning hydrogen produced without carbon emissions). But it’s likely that, even with these credits, the economics wouldn’t favor the use of these technologies when alternatives like renewables plus storage are available. The IRA also provides tax credits for deploying renewables and storage, pushing the economics even further in their favor.
Since not a lot changes, the rules don’t really affect the cost of electricity significantly. Their presence boosts costs by an estimated 0.5 to 3.7 percent in 2050 compared to a scenario where the rules aren’t implemented. As a result, the wholesale price of electricity changes by only two percent.
A backstop
That said, the team behind the analysis argues that, depending on other factors, the rules could play a significant role. Trump has suggested he will target all of Biden’s energy policies, and that would include the IRA itself. Its repeal could significantly slow the growth of renewable energy in the US, as could continued problems with expanding the grid to incorporate new renewable capacity.
In addition, the US is seeing demand for electricity rise at a faster pace in 2023 than in the decade leading up to it. While it’s still unclear whether that’s a result of new demand or simply weather conditions boosting the use of electricity in heating and cooling, there are several factors that could easily boost the use of electricity in coming years: the electrification of transport, rising data center use, and the electrification of appliances and home heating.
Should these raise demand sufficiently, then it could make continued coal use economical in the absence of the EPA rules. “The rules … can be viewed as backstops against higher emissions outcomes under futures with improved coal plant economics,” the paper suggests, “which could occur with higher demand, slower renewables deployment from interconnection and permitting delays, or higher natural gas prices.”
And it may be the only backstop we have. The report also notes that a number of states have already set aggressive emissions reduction targets, including some for net zero by 2050. But these don’t serve as a substitute for federal climate policy, given that the states that are taking these steps use very little coal in the first place.
John is Ars Technica’s science editor. He has a Bachelor of Arts in Biochemistry from Columbia University, and a Ph.D. in Molecular and Cell Biology from the University of California, Berkeley. When physically separated from his keyboard, he tends to seek out a bicycle, or a scenic location for communing with his hiking boots.
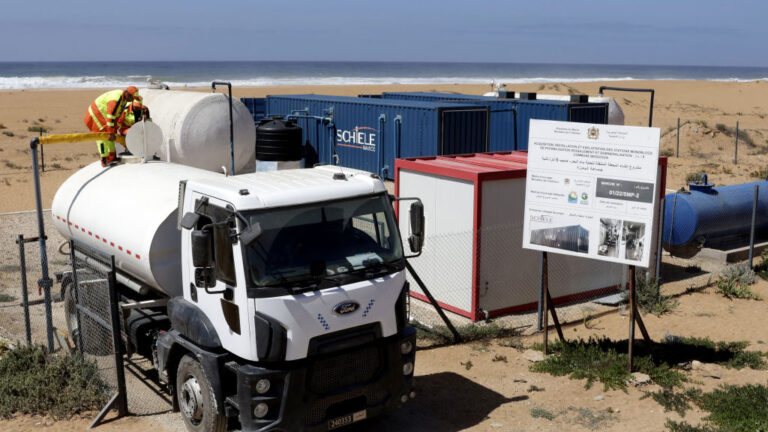
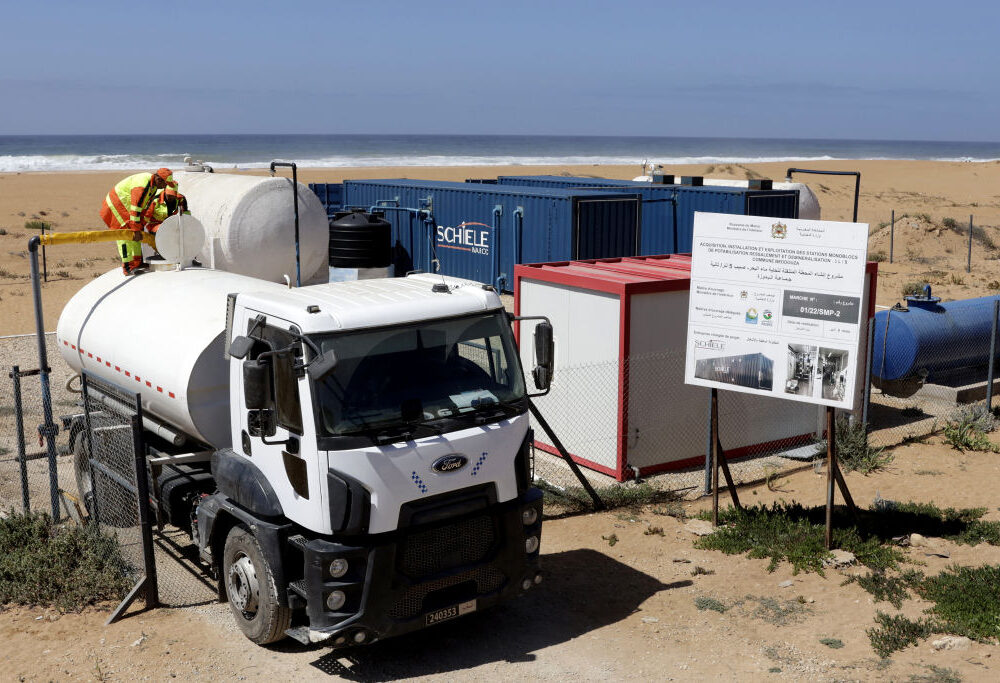
Instead of needing constant power, new system adjusts to use whatever is available.
Mobile desalination plants might be easier to operate with renewable power. Credit: Ismail BELLAOUALI
Fresh water we can use for drinking or agriculture is only about 3 percent of the global water supply, and nearly 70 percent of that is trapped in glaciers and ice caps. So far, that was enough to keep us going, but severe draughts have left places like Jordan, Egypt, sub-Saharan Africa, Spain, and California with limited access to potable water.
One possible solution is to tap into the remaining 97 percent of the water we have on Earth. The problem is that this water is saline, and we need to get the salt out of it to make it drinkable. Desalination is also an energy-expensive process. But MIT researchers led by Jonathan Bessette might have found an answer to that. They built an efficient, self-regulating water desalination system that runs on solar power alone with no need for batteries or a connection to the grid.
Probing the groundwaters
Oceans are the most obvious source of water for desalination. But they are a good option only for a small portion of people who live in coastal areas. Most of the global population—more or less 60 percent—lives farther than 100 kilometers from the coast, which makes using desalinated ocean water infeasible. So, Bessette and his team focused on groundwater instead.
“In terms of global demand, about 50 percent of low- to middle-income countries rely on groundwater,” Bessette says. This groundwater is trapped in underground reservoirs, abundant, and, in most places, present at depths below 300 meters. It comes mostly from the rain that penetrates the ground and fills empty spaces left by fractured rock formations. Sadly, as the rainwater seeps down it also picks up salts from the soil on its way. As a result, in New Mexico, for example, around 75 percent of groundwater is brackish, meaning less salty than seawater, but still too salty to drink.
Getting rid of the salt
We already have the ability to get the salt back out. “There are two broad categories within desalination technologies. The first is thermal and the other is based on using membranes,” Bessette explains.
Thermal desalination is something we figured out ages ago. You just boil the water and condense the steam, which leaves the salt behind. Boiling, however, needs lots of energy. Bringing 1 liter of room temperature water to 100° Celsius costs around 330 kilojoules of energy, assuming there’s no heat lost in the process. If you want a sense of how much energy that is, stop using your electric kettle for a month and see how your bill shrinks.
“So, around 100 years ago we developed reverse osmosis and electrodialysis, which are two membrane-based desalination technologies. This way, we reduced the power consumption by a factor of 10,” Bessette claims.
Reverse osmosis is a pressure-driven process; you push the water through a membrane that works like a very fine sieve that lets the molecules of water pass but stops other things like salts. Technologically advanced implementations of this idea are widely used at industrial facilities such as the Sydney Desalination Plant in Australia. Reverse osmosis today is the go-to technology when you want to desalinate water at scale. But it has its downsides.
“The issue is reverse osmosis requires a lot of pretreatment. We have to treat the water down to a pretty good quality, making sure the physical, chemical, or biological foul doesn’t end up on the membrane before we do the desalination process,” says Bessette. Another thing is that reverse osmosis relies on pressure, so it requires a steady supply of power to maintain this pressure, which is difficult to achieve in places where the grid is not reliable. Sensitivity to power fluctuations also makes it challenging to use with renewable energy sources like wind or solar. This is why to make their system work on solar energy alone, Bessette’s team went for electrodialysis.
Synching with the Sun
“Unlike reverse osmosis, electrodialysis is an electrically driven process,” Bessette says. The membranes are arranged in such a way that the water is not pushed through them but flows along them. On both sides of those membranes are positive and negative electrodes that create an electric field, which draws salt ions through the membranes and out of the water.
Off-grid desalination systems based on electrodialysis operate at constant power levels like toasters or other appliances, which means they require batteries to even out renewable energy’s fluctuations. Using batteries, in most cases, made them too expensive for the low-income communities that need them the most. Bessette and his colleagues solved that by designing a clever control system.
The two most important parameters in electrodialysis desalination are the flow rate of the water and the power you apply to the electrodes. To make the process efficient, you need to match those two. The advantage of electrodialysis is that it can operate at different power levels. When you have more available power, you can just pump more water through the system. When you have less power, you can slow the system down by reducing the water flow rate. You’ll produce less freshwater, but you won’t break anything this way.
Bessette’s team simplified the control down to two feedback loops. The first outer loop was tracking the power coming from the solar panels. On a sunny day, when the panels generated plenty of power, it fed more water into the system; when there was less power, it fed less water. The second inner loop tracked flow rate. When the flow rate was high, it applied more power to the electrodes; when it was low, it applied less power. The trick was to apply maximum available power while avoiding splitting the water into hydrogen and oxygen.
Once Bessette and his colleagues figured out the control system, they built a prototype desalination device. And it worked, with very little supervision, for half a year.
Water production at scale
Bessette’s prototype system, complete with solar panels, pumps, electronics, and an electrodialysis stack with all the electrodes and membranes, was compact enough to fit in a trailer. They took this trailer to the Brackish Groundwater National Research Facility in Alamogordo, New Mexico, and ran it for six months. On average, it desalinated around 5,000 liters of water per day—enough for a community of roughly 2,000 people.
“The nice thing with our technology is it is more of a control method. The concept can be scaled anywhere from this small community treatment system all the way to large-scale plants,” Bessette says. He said his team is now busy building an equivalent of a single water treatment train, a complete water desalination unit designed for big municipal water supplies. “Multiple such [systems] are implemented in such plants to increase the scale of water desalination process,” Bessette says. But he also thinks about small-scale solutions that can be fitted on a pickup truck and deployed rapidly in crisis scenarios like natural disasters.
“We’re also working on building a company. Me, two other staff engineers, and our professor. We’re really hoping to bring this technology to market and see that it reaches a lot of people. Our aim is to provide clean drinking water to folks in remote regions around the world,” Bessette says.
Jacek Krywko is a freelance science and technology writer who covers space exploration, artificial intelligence research, computer science, and all sorts of engineering wizardry.
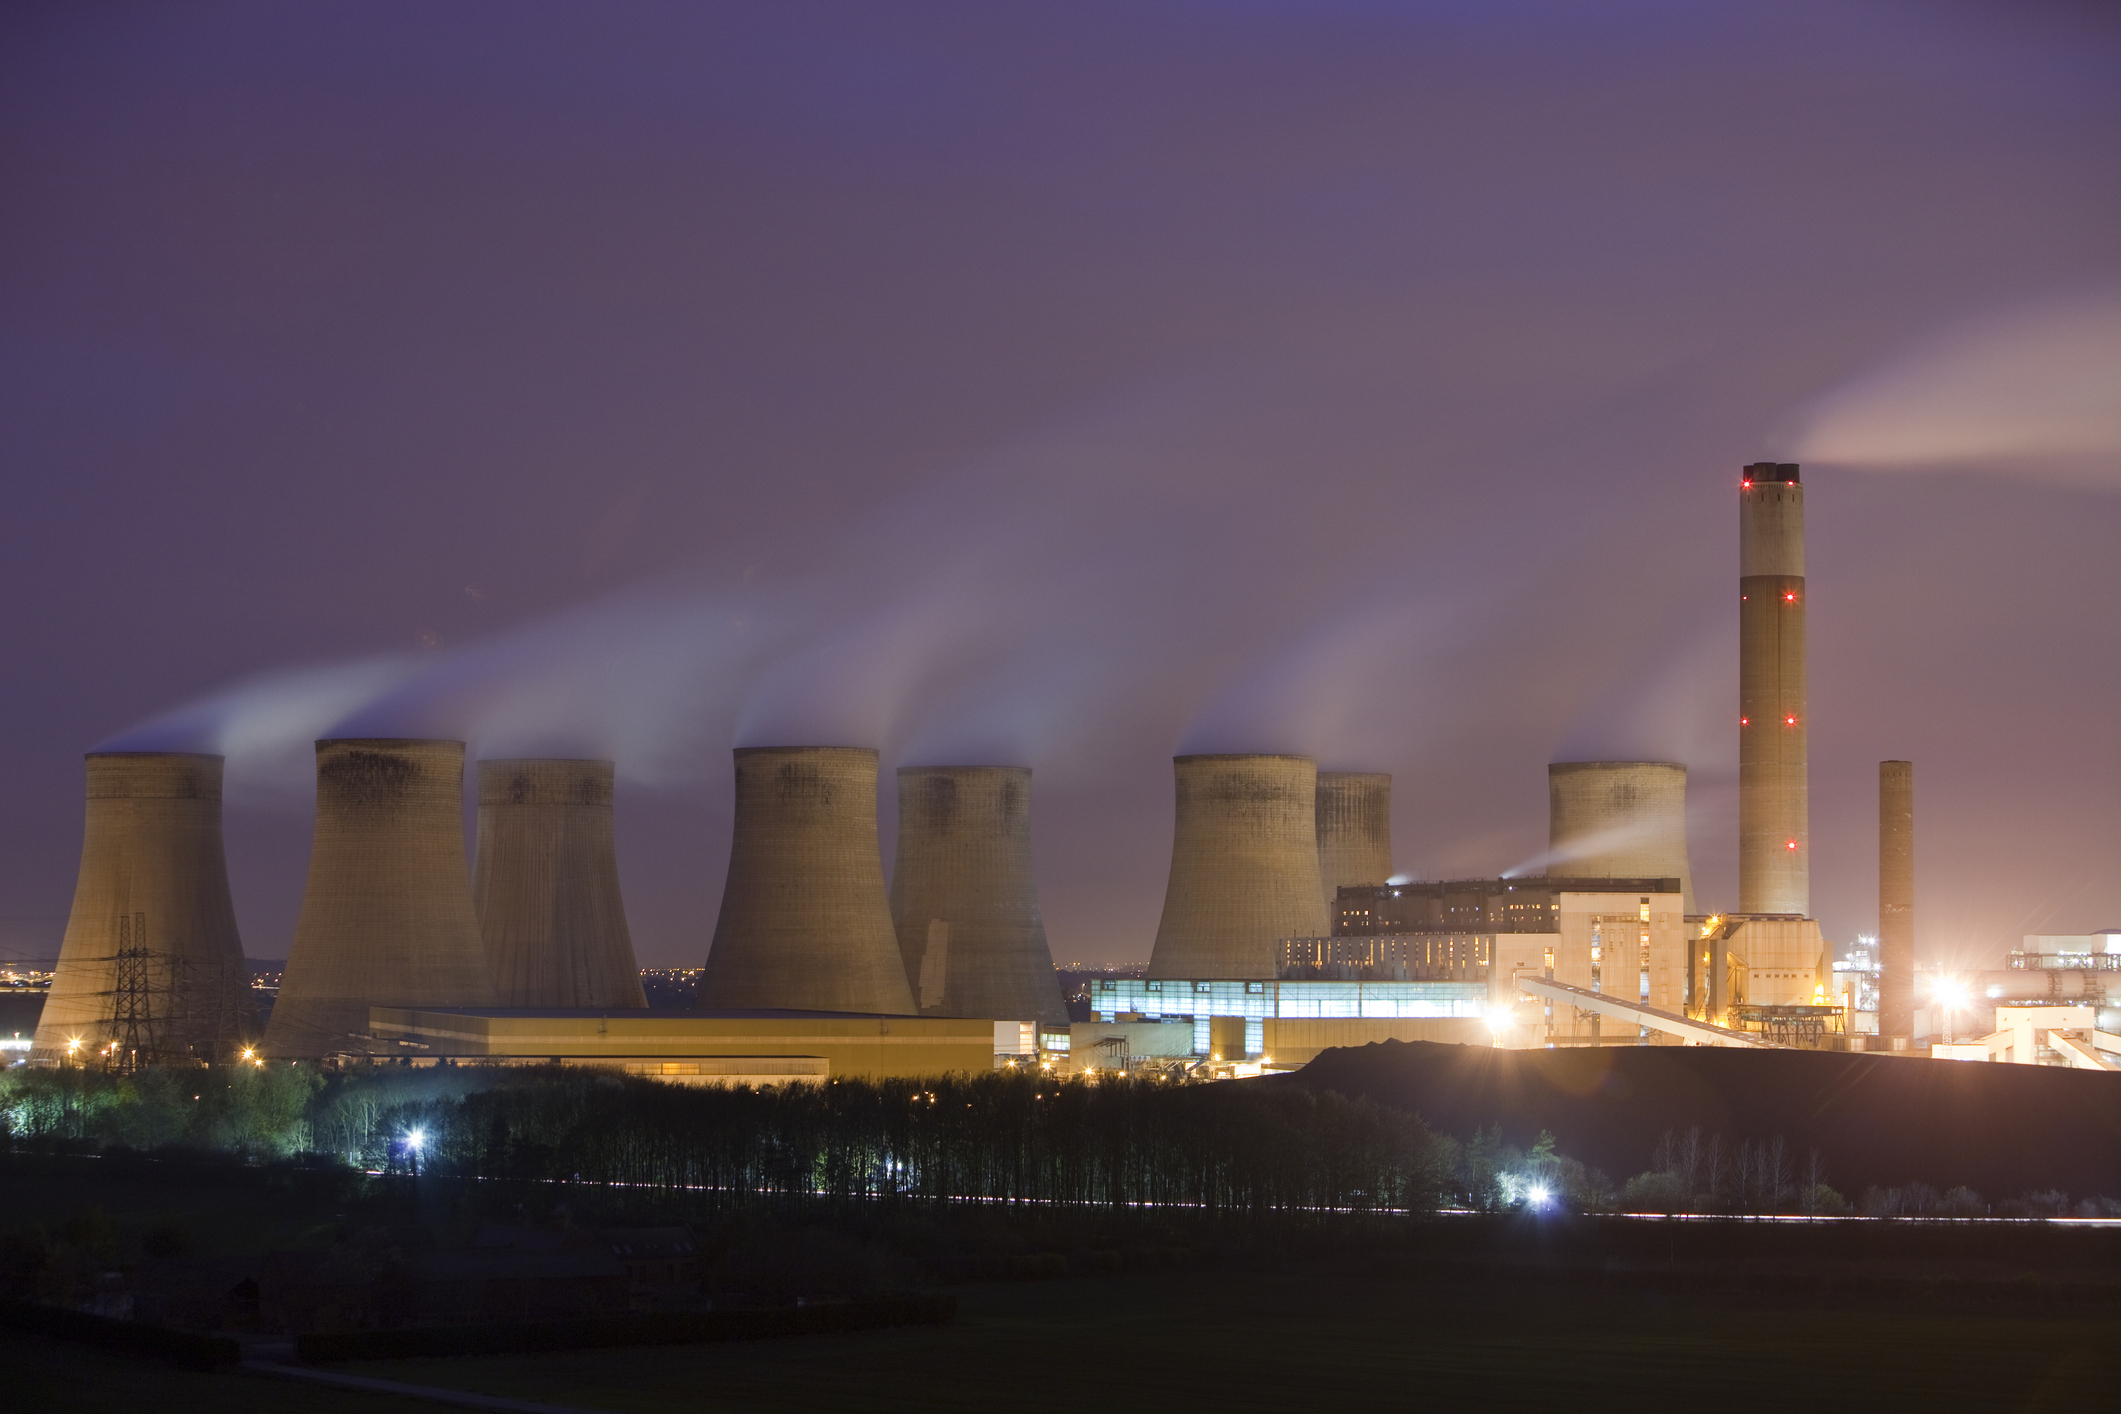
Enlarge/ The Ratcliffe-on-Soar plant is set to shut down for good today.
On Monday, the UK will see the closure of its last operational coal power plant, Ratcliffe-on-Soar, which has been operating since 1968. The closure of the plant, which had a capacity of 2,000 megawatts, will bring an end to the history of the country’s coal use, which started with the opening of the first coal-fired power station in 1882. Coal played a central part in the UK’s power system in the interim, in some years providing over 90 percent of its total electricity.
But a number of factors combined to place coal in a long-term decline: the growth of natural gas-powered plants and renewables, pollution controls, carbon pricing, and a government goal to hit net-zero greenhouse gas emissions by 2050.
From boom to bust
It’s difficult to overstate the importance of coal to the UK grid. It was providing over 90 percent of the UK’s electricity as recently as 1956. The total amount of power generated continued to climb well after that, reaching a peak of 212 terawatt hours of production by 1980. And the construction of new coal plants was under consideration as recently as the late 2000s. According to the organization Carbon Brief’s excellent timeline of coal use in the UK, continuing the use of coal with carbon capture was given consideration.
But several factors slowed the use of fuel ahead of any climate goals set out by the UK, some of which have parallels to the US’s situation. The European Union, which included the UK at the time, instituted new rules to address acid rain, which raised the cost of coal plants. In addition, the exploitation of oil and gas deposits in the North Sea provided access to an alternative fuel. Meanwhile, major gains in efficiency and the shift of some heavy industry overseas cut demand in the UK significantly.
Through their effect on coal use, these changes also lowered employment in coal mining. The mining sector has sometimes been a significant force in UK politics, but the decline of coal reduced the number of people employed in the sector, reducing its political influence.
These had all reduced the use of coal even before governments started taking any aggressive steps to limit climate change. But, by 2005, the EU implemented a carbon trading system that put a cost on emissions. By 2008, the UK government adopted national emissions targets, which have been maintained and strengthened since then by both Labour and Conservative governments up until Rishi Sunak, who was voted out of office before he had altered the UK’s trajectory. What started as a pledge for a 60 percent reduction in greenhouse gas emissions by 2050 now requires the UK to hit net zero by that date.
Enlarge/ Renewables, natural gas, and efficiency have all squeezed coal off the UK grid.
These have included a floor on the price of carbon that ensures fossil-powered plants pay a cost for emissions that’s significant enough to promote the transition to renewables, even if prices in the EU’s carbon trading scheme are too low for that. And that transition has been rapid, with the total generations by renewables nearly tripling in the decade since 2013, heavily aided by the growth of offshore wind.
How to clean up the power sector
The trends were significant enough that, in 2015, the UK announced that it would target the end of coal in 2025, despite the fact that the first coal-free day on the grid wouldn’t come until two years after. But two years after that landmark, however, the UK was seeing entire weeks where no coal-fired plants were active.
To limit the worst impacts of climate change, it will be critical for other countries to follow the UK’s lead. So it’s worthwhile to consider how a country that was committed to coal relatively recently could manage such a rapid transition. There are a few UK-specific factors that won’t be possible to replicate everywhere. The first is that most of its coal infrastructure was quite old—Ratcliffe-on-Soar dates from the 1960s—and so it required replacement in any case. Part of the reason for its aging coal fleet was the local availability of relatively cheap natural gas, something that might not be true elsewhere, which put economic pressure on coal generation.
Another key factor is that the ever-shrinking number of people employed by coal power didn’t exert significant pressure on government policies. Despite the existence of a vocal group of climate contrarians in the UK, the issue never became heavily politicized. Both Labour and Conservative governments maintained a fact-based approach to climate change and set policies accordingly. That’s notably not the case in countries like the US and Australia.
But other factors are going to be applicable to a wide variety of countries. As the UK was moving away from coal, renewables became the cheapest way to generate power in much of the world. Coal is also the most polluting source of electrical power, providing ample reasons for regulation that have little to do with climate. Forcing coal users to pay even a fraction of its externalized costs on human health and the environment serve to make it even less economical compared to alternatives.
If these later factors can drive a move away from coal despite government inertia, then it can pay significant dividends in the fight to limit climate change. Inspired in part by the success in moving its grid off coal, the new Labour government in the UK has moved up its timeline for decarbonizing its power sector to 2030 (up from the previous Conservative government’s target of 2035).
Our planet is choking on plastics. Some of the worst offenders, which can take decades to degrade in landfills, are polypropylene—which is used for things such as food packaging and bumpers—and polyethylene, found in plastic bags, bottles, toys, and even mulch.
Polypropylene and polyethylene can be recycled, but the process can be difficult and often produces large quantities of the greenhouse gas methane. They are both polyolefins, which are the products of polymerizing ethylene and propylene, raw materials that are mainly derived from fossil fuels. The bonds of polyolefins are also notoriously hard to break.
Now, researchers at the University of California, Berkeley have come up with a method of recycling these polymers that uses catalysts that easily break their bonds, converting them into propylene and isobutylene, which are gasses at room temperature. Those gasses can then be recycled into new plastics.
“Because polypropylene and polyethylene are among the most difficult and expensive plastics to separate from each other in a mixed waste stream, it is crucial that [a recycling] process apply to both polyolefins,” the research team said in a study recently published in Science.
Breaking it down
The recycling process the team used is known as isomerizing ethenolysis, which relies on a catalyst to break down olefin polymer chains into their small molecules. Polyethylene and polypropylene bonds are highly resistant to chemical reactions because both of these polyolefins have long chains of single carbon-carbon bonds. Most polymers have at least one carbon-carbon double bond, which is much easier to break.
While isomerizing ethenolysis had been tried by the same researchers before, the previous catalysts were expensive metals that did not remain pure long enough to convert all of the plastic into gas. Using sodium on alumina followed by tungsten oxide on silica proved much more economical and effective, even though the high temperatures required for the reaction added a bit to the cost
In both plastics, exposure to sodium on alumina broke each polymer chain into shorter polymer chains and created breakable carbon-carbon double bonds at the ends. The chains continued to break over and over. Both then underwent a second process known as olefin metathesis. They were exposed to a stream of ethylene gas flowing into a reaction chamber while being introduced to tungsten oxide on silica, which resulted in the breakage of the carbon-carbon bonds.
The reaction breaks all the carbon-carbon bonds in polyethylene and polypropylene, with the carbon atoms released during the breaking of these bonds ending up attached to molecules of ethylene.“The ethylene is critical to this reaction, as it is a co-reactant,” researcher R.J. Conk, one of the authors of the study, told Ars Technica. “The broken links then react with ethylene, which removes the links from the chain. Without ethylene, the reaction cannot occur.”
The entire chain is catalyzed until polyethylene is fully converted to propylene, and polypropylene is converted to a mixture of propylene and isobutylene.
This method has high selectivity—meaning it produces a large amount of the desired product. That means propylene derived from polyethylene, and both propylene and isobutylene derived from polypropylene. Both of these chemicals are in high demand, since propylene is an important raw material for the chemical industry, while isobutylene is a frequently used monomer in many different polymers, including synthetic rubber and a gasoline additive.
Mixing it up
Because plastics are often mixed at recycling centers, the researchers wanted to see what would happen if polypropylene and polyethylene underwent isomerizing ethenolysis together. The reaction was successful, converting the mixture into propylene and isobutylene, with slightly more propylene than isobutylene.
Mixtures also typically include contaminants in the form of additional plastics. So the team also wanted to see whether the reaction would still work if there were contaminants. So they experimented with plastic objects that would otherwise be thrown away, including a centrifuge and a bread bag, both of which contained traces of other polymers besides polypropylene and polyethylene. The reaction yielded only slightly less propylene and isobutylene than it did with unadulterated versions of the polyolefins.
Another test involved introducing different plastics, such as PET and PVC, to polypropylene and polyethylene to see if that would make a difference. These did lower the yield significantly. If this approach is going to be successful, then all but the slightest traces of contaminants will have to be removed from polypropylene and polyethylene products before they are recycled.
While this recycling method sounds like it could prevent tons upon tons of waste, it will need to be scaled up enormously for this to happen. When the research team increased the scale of the experiment, it produced the same yield, which looks promising for the future. Still, we’ll need to build considerable infrastructure before this could make a dent in our plastic waste.
“We hope that the work described…will lead to practical methods for…[producing] new polymers,” the researchers said in the same study. “By doing so, the demand for production of these essential commodity chemicals starting from fossil carbon sources and the associated greenhouse gas emissions could be greatly reduced.”
While solar power is growing at an extremely rapid clip, in absolute terms, the use of natural gas for electricity production has continued to outpace renewables. But that looks set to change in 2024, as the US Energy Information Agency (EIA) has run the numbers on the first half of the year and found that wind, solar, and batteries were each installed at a pace that dwarfs new natural gas generators. And the gap is expected to get dramatically larger before the year is over.
Solar, batteries booming
According to the EIA’s numbers, about 20 GW of new capacity was added in the first half of this year, and solar accounts for 60 percent of it. Over a third of the solar additions occurred in just two states, Texas and Florida. There were two projects that went live that were rated at over 600 MW of capacity, one in Texas, the other in Nevada.
Next up is batteries: The US saw 4.2 additional gigawatts of battery capacity during this period, meaning over 20 percent of the total new capacity. (Batteries are treated as the equivalent of a generating source by the EIA since they can dispatch electricity to the grid on demand, even if they can’t do so continuously.) Texas and California alone accounted for over 60 percent of these additions; throw in Arizona and Nevada, and you’re at 93 percent of the installed capacity.
The clear pattern here is that batteries are going where the solar is, allowing the power generated during the peak of the day to be used to meet demand after the sun sets. This will help existing solar plants avoid curtailing power production during the lower-demand periods in the spring and fall. In turn, this will improve the economic case for installing additional solar in states where its production can already regularly exceed demand.
Wind power, by contrast, is running at a more sedate pace, with only 2.5 GW of new capacity during the first six months of 2024. And for likely the last time this decade, additional nuclear power was placed on the grid, at the fourth 1.1 GW reactor (and second recent build) at the Vogtle site in Georgia. The only other additions came from natural gas-powered facilities, but these totaled just 400 MW, or just 2 percent of the total of new capacity.
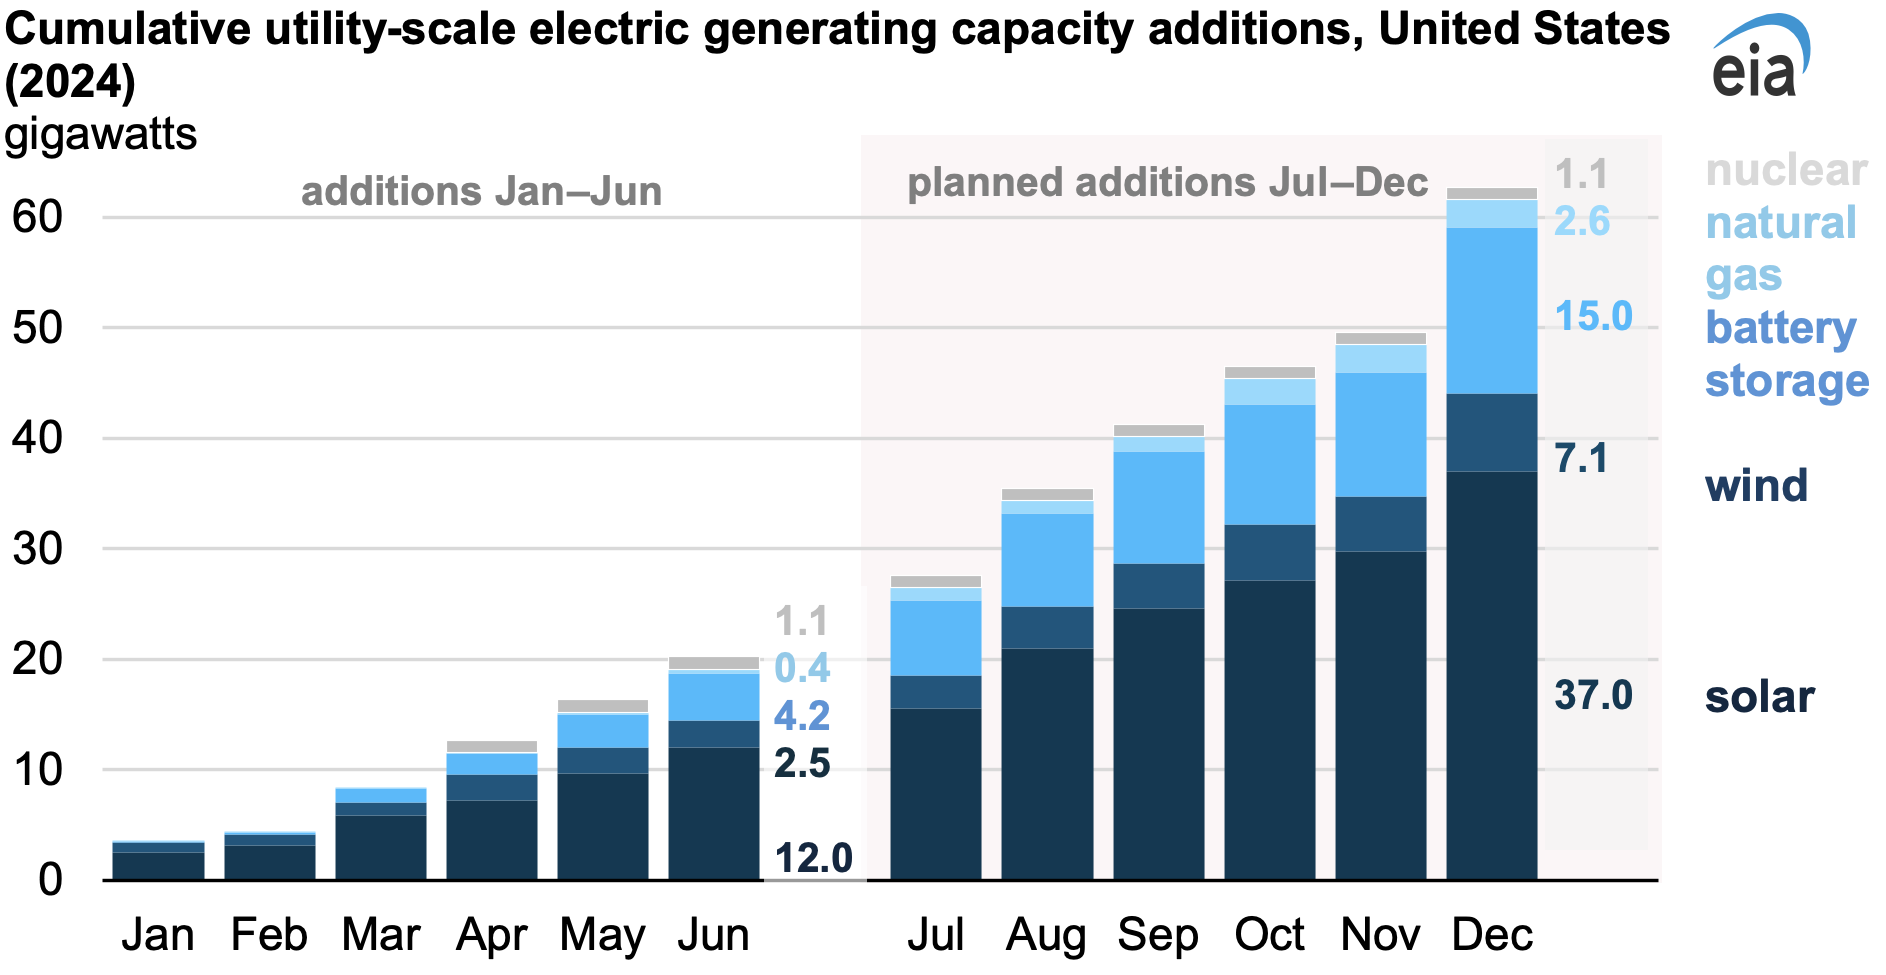
Enlarge/ Wind, solar, and batteries are the key contributors to new capacity in 2024.
The EIA has also projected capacity additions out to the end of 2024 based on what’s in the works, and the overall shape of things doesn’t change much. However, the pace of installation goes up as developers rush to get their project operational within the current tax year. The EIA expects a bit over 60 GW of new capacity to be installed by the end of the year, with 37 GW of that coming in the form of solar power. Battery growth continues at a torrid pace, with 15 GW expected, or roughly a quarter of the total capacity additions for the year.
Wind will account for 7.1 GW of new capacity, and natural gas 2.6 GW. Throw in the contribution from nuclear, and 96 percent of the capacity additions of 2024 are expected to operate without any carbon emissions. Even if you choose to ignore the battery additions, the fraction of carbon-emitting capacity added remains extremely small, at only 6 percent.
Gradual shifts on the grid
Obviously, these numbers represent the peak production of these sources. Over a year, solar produces at about 25 percent of its rated capacity in the US, and wind at about 35 percent. The former number will likely decrease over time as solar becomes inexpensive enough to make economic sense in places that don’t receive as much sunshine. By contrast, wind’s capacity factor may increase as more offshore wind farms get completed. For natural gas, many of the newer plants are being designed to operate erratically so that they can provide power when renewables are under-producing.
A clearer sense of what’s happening comes from looking at the generating sources that are being retired. The US saw 5.1 GW of capacity drop off the grid in the first half of 2024, and aside from a 0.2 GW of “other,” all of it was fossil fuel-powered, including 2.1 GW of coal capacity and 2.7 GW of natural gas. The latter includes a large 1.4 GW natural gas plant in Massachusetts.
But total retirements are expected to be just 7.5 GWO this year—less than was retired in the first half of 2023. That’s likely because the US saw electricity use rise by 5 percent in the first half of 2025, based on numbers the EIA released on Friday (note that this link will take you to more recent data a month from now). It’s unclear how much of that was due to weather—a lot of the country saw heat that likely boosted demand for air conditioning—and how much could be accounted for by rising use in data centers and for the electrification of transit and appliances.
That data release includes details on where the US got its electricity during the first half of 2024. The changes aren’t dramatic compared to where they were when we looked at things last month. Still, what has changed over the past month is good news for renewables. In May, wind and solar production were up 8.4 percent compared to the same period the year before. By June, they were up by over 12 percent.
Given the EIA’s expectations for the rest of the year, the key question is likely to be whether the pace of new solar installations is going to be enough to offset the drop in production that will occur as the US shifts to the winter months.
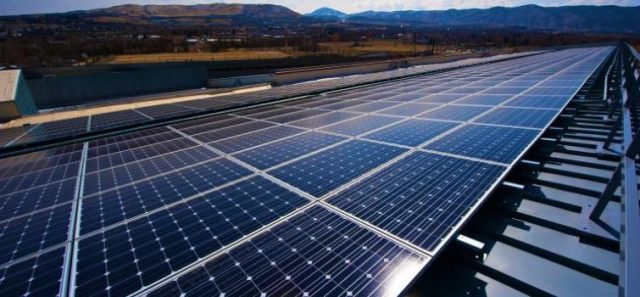
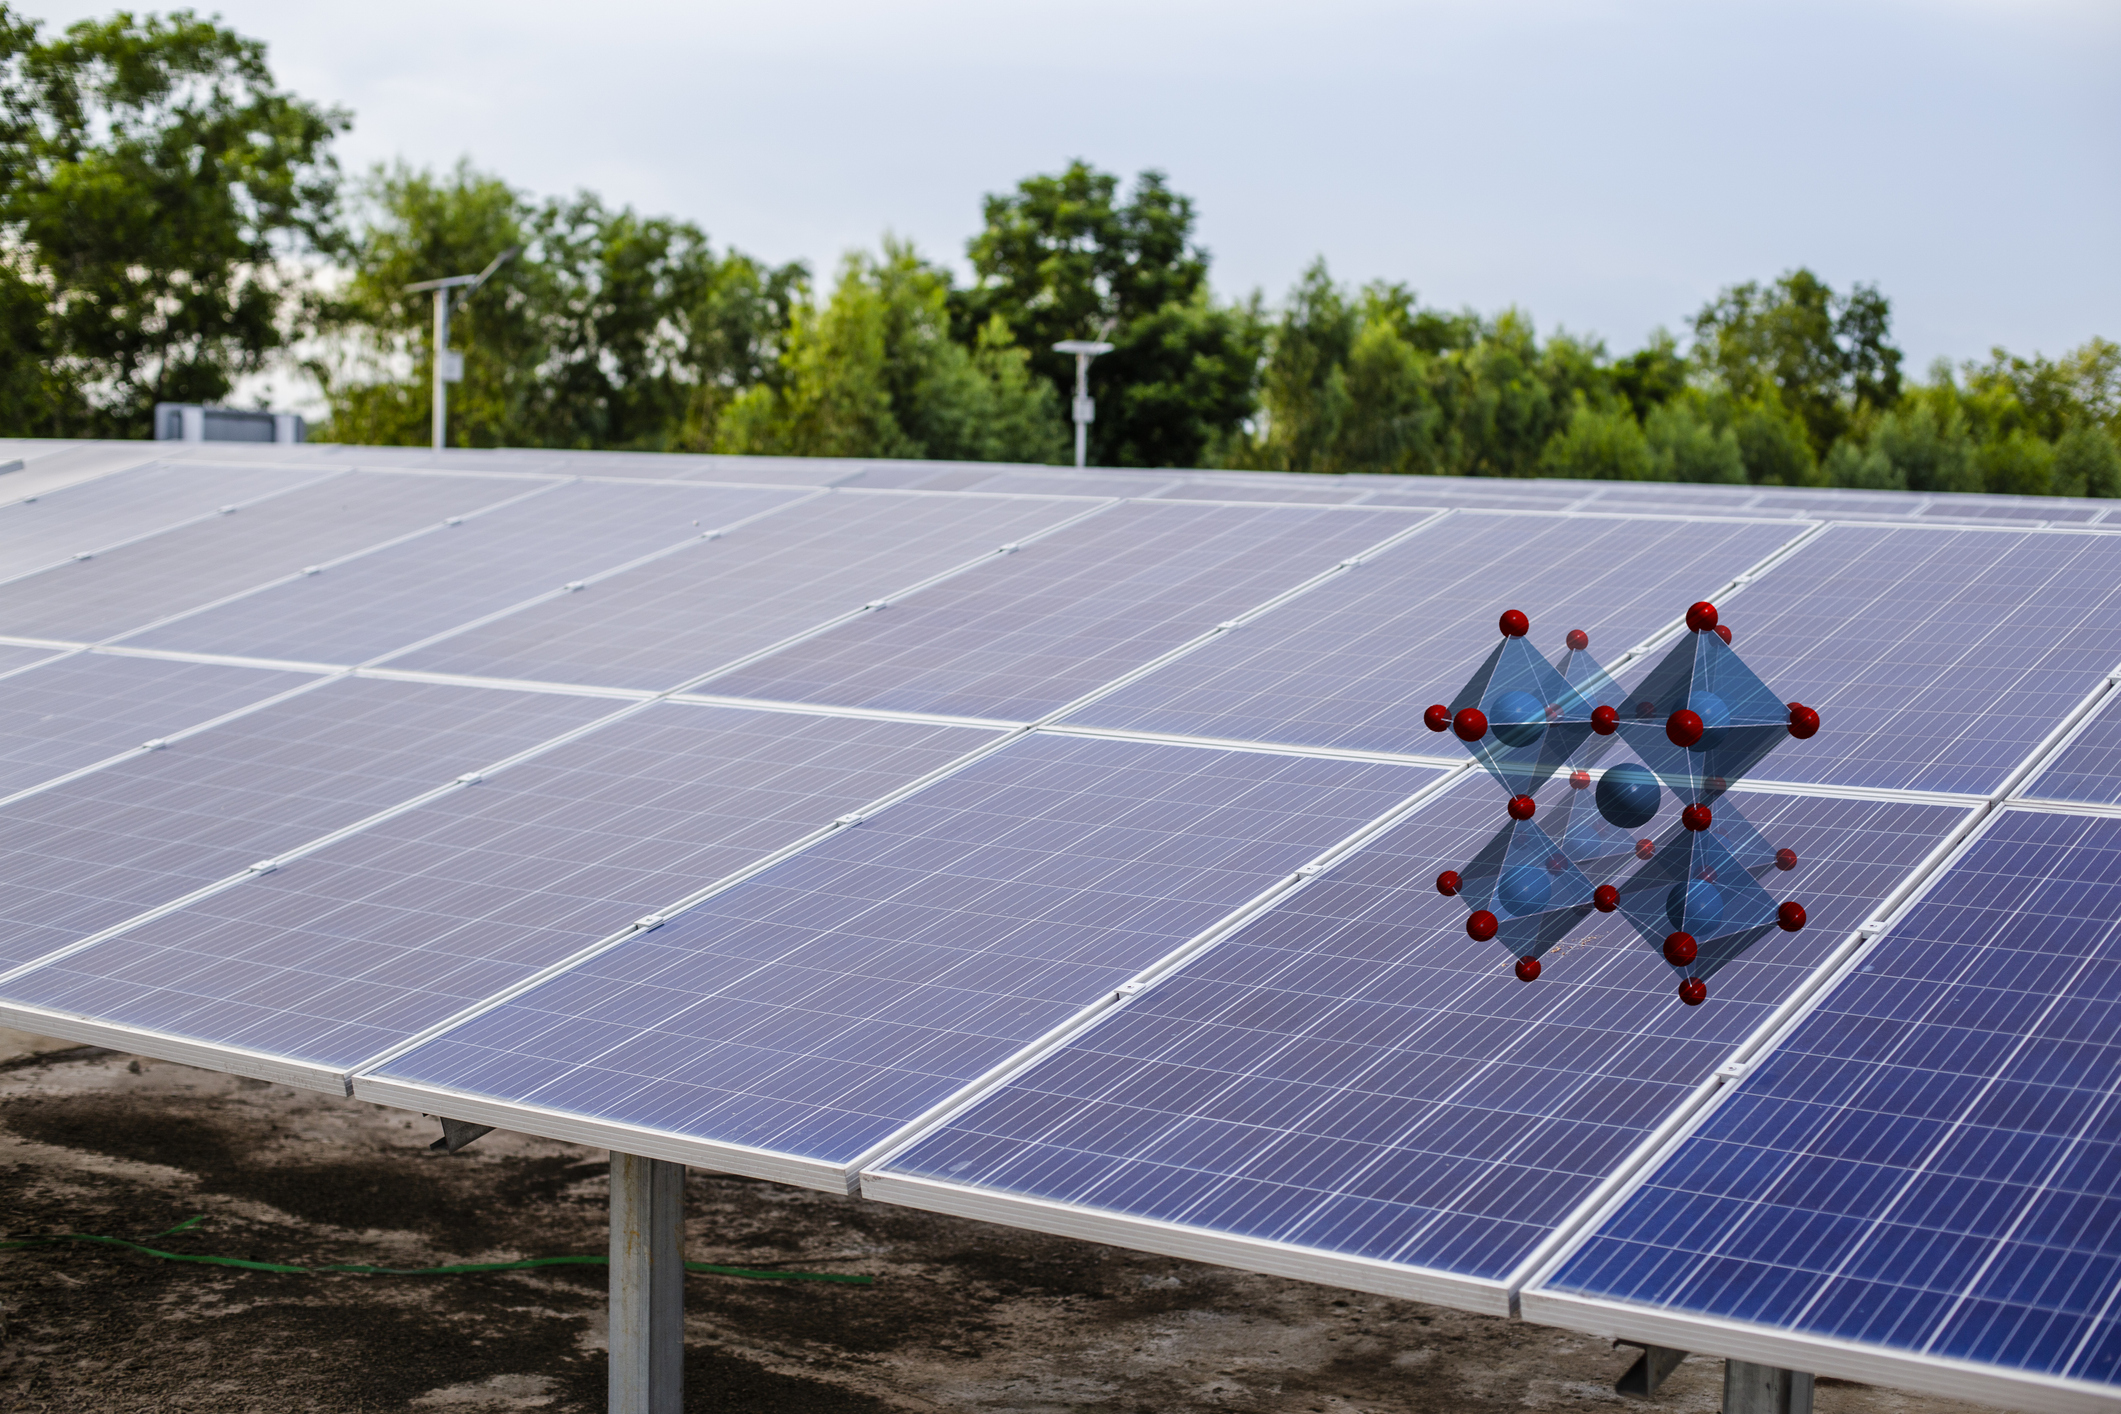
Enlarge/ Some solar panels, along with a diagram of a perovskite’s crystal structure.
As the price of silicon panels has continued to come down, we’ve reached the point where they’re a small and shrinking cost of building a solar farm. That means that it might be worth spending more to get a panel that converts more of the incoming sunlight to electricity, since it allows you to get more out of the price paid to get each panel installed. But silicon panels are already pushing up against physical limits on efficiency. Which means our best chance for a major boost in panel efficiency may be to combine silicon with an additional photovoltaic material.
Right now, most of the focus is on pairing silicon with a class of materials called perovskites. Perovskite crystals can be layered on top of silicon, creating a panel with two materials that absorb different areas of the spectrum—plus, perovskites can be made from relatively cheap raw materials. Unfortunately, it has been difficult to make perovskites that are both high-efficiency and last for the decades that the silicon portion will.
Lots of labs are attempting to change that, though. And two of them reported some progress this week, including a perovskite/silicon system that achieved 34 percent efficiency.
Boosting perovskite stability
Perovskites are an entire class of materials that all form the same crystal structure. So, there is plenty of flexibility when it comes to the raw materials being used. Perovskite-based photovoltaics are typically formed by what’s called solution processing, in which all the raw materials are dissolved in a liquid that’s then layered on top of the panel-to-be, allowing perovskite crystals to form across its entire surface. Which is great, except that this process tends to form multiple crystals with different orientations on a single surface, decreasing performance.
Adding to the problems, perovskites are also not especially stable. They’re usually made of a combination of positively and negatively charged ions, and these have to be present in the right ratios to form a perovskite. However, some of these individual ions can diffuse over time, disrupting the crystal structure. Harvesting solar energy, which involves the material absorbing lots of energy, makes matters worse by heating the material, which increases the rate of diffusion.
Combined, these factors sap the efficiency of perovskite solar cells and mean that none lasts nearly as long as a sheet of silicon. The new works tackle these issues from two very different directions.
The first of the new papers tackles stability by using the flexibility of perovskites to incorporate various ions. The researchers started by using a technique called density functional theory to model how different molecules would behave when placed into a spot normally occupied by a positively charged ion. And the modeling got them excited about a molecule called tetrahydrotriazinium, which has a six-atom ring composed of alternating carbon and nitrogen atoms. The regular placement of nitrogens around the ring allows it to form regular interactions with neighboring atoms in the crystal structure.
Tetrahydrotriazinium has a neutral charge when only two of the nitrogens have hydrogens attached to them. But it typically grabs a charged hydrogen (effectively, a proton) out of solution, giving it a net positive charge. This leaves each of its three nitrogens associated with a hydrogen and allows the positive charge to be distributed among them. That makes this interaction incredibly strong, meaning that the hydrogens are extremely unlikely to drift off, which also stabilizes the crystal structure.
So, this should make perovskites much, much more stable. The only problem? Tetrahydrotriazinium tends to react with lots of other chemicals, so it’s difficult to provide as a raw material for the perovskite-forming solution.
With the plunging price of photovoltaics, the construction of solar plants has boomed in the US. Last year, for example, the US’s Energy Information Agency expected that over half of the new generating capacity would be solar, with a lot of it coming online at the very end of the year for tax reasons. Yesterday, the EIA released electricity generation numbers for the first five months of 2024, and that construction boom has seemingly made itself felt: generation by solar power has shot up by 25 percent compared to just one year earlier.
The EIA breaks down solar production according to the size of the plant. Large grid-scale facilities have their production tracked, giving the EIA hard numbers. For smaller installations, like rooftop solar on residential and commercial buildings, the agency has to estimate the amount produced, since the hardware often resides behind the metering equipment, so only shows up via lower-than-expected consumption.
In terms of utility-scale production, the first five months of 2024 saw it rise by 29 percent compared to the same period in the year prior. Small-scale solar was “only” up by 18 percent, with the combined number rising by 25.3 percent.
Most other generating sources were largely flat, year over year. This includes coal, nuclear, and hydroelectric, all of which changed by 2 percent or less. Wind was up by 4 percent, while natural gas rose by 5 percent. Because natural gas is the largest single source of energy on the grid, however, its 5 percent rise represents a lot of electrons—slightly more than the total increase in wind and solar.
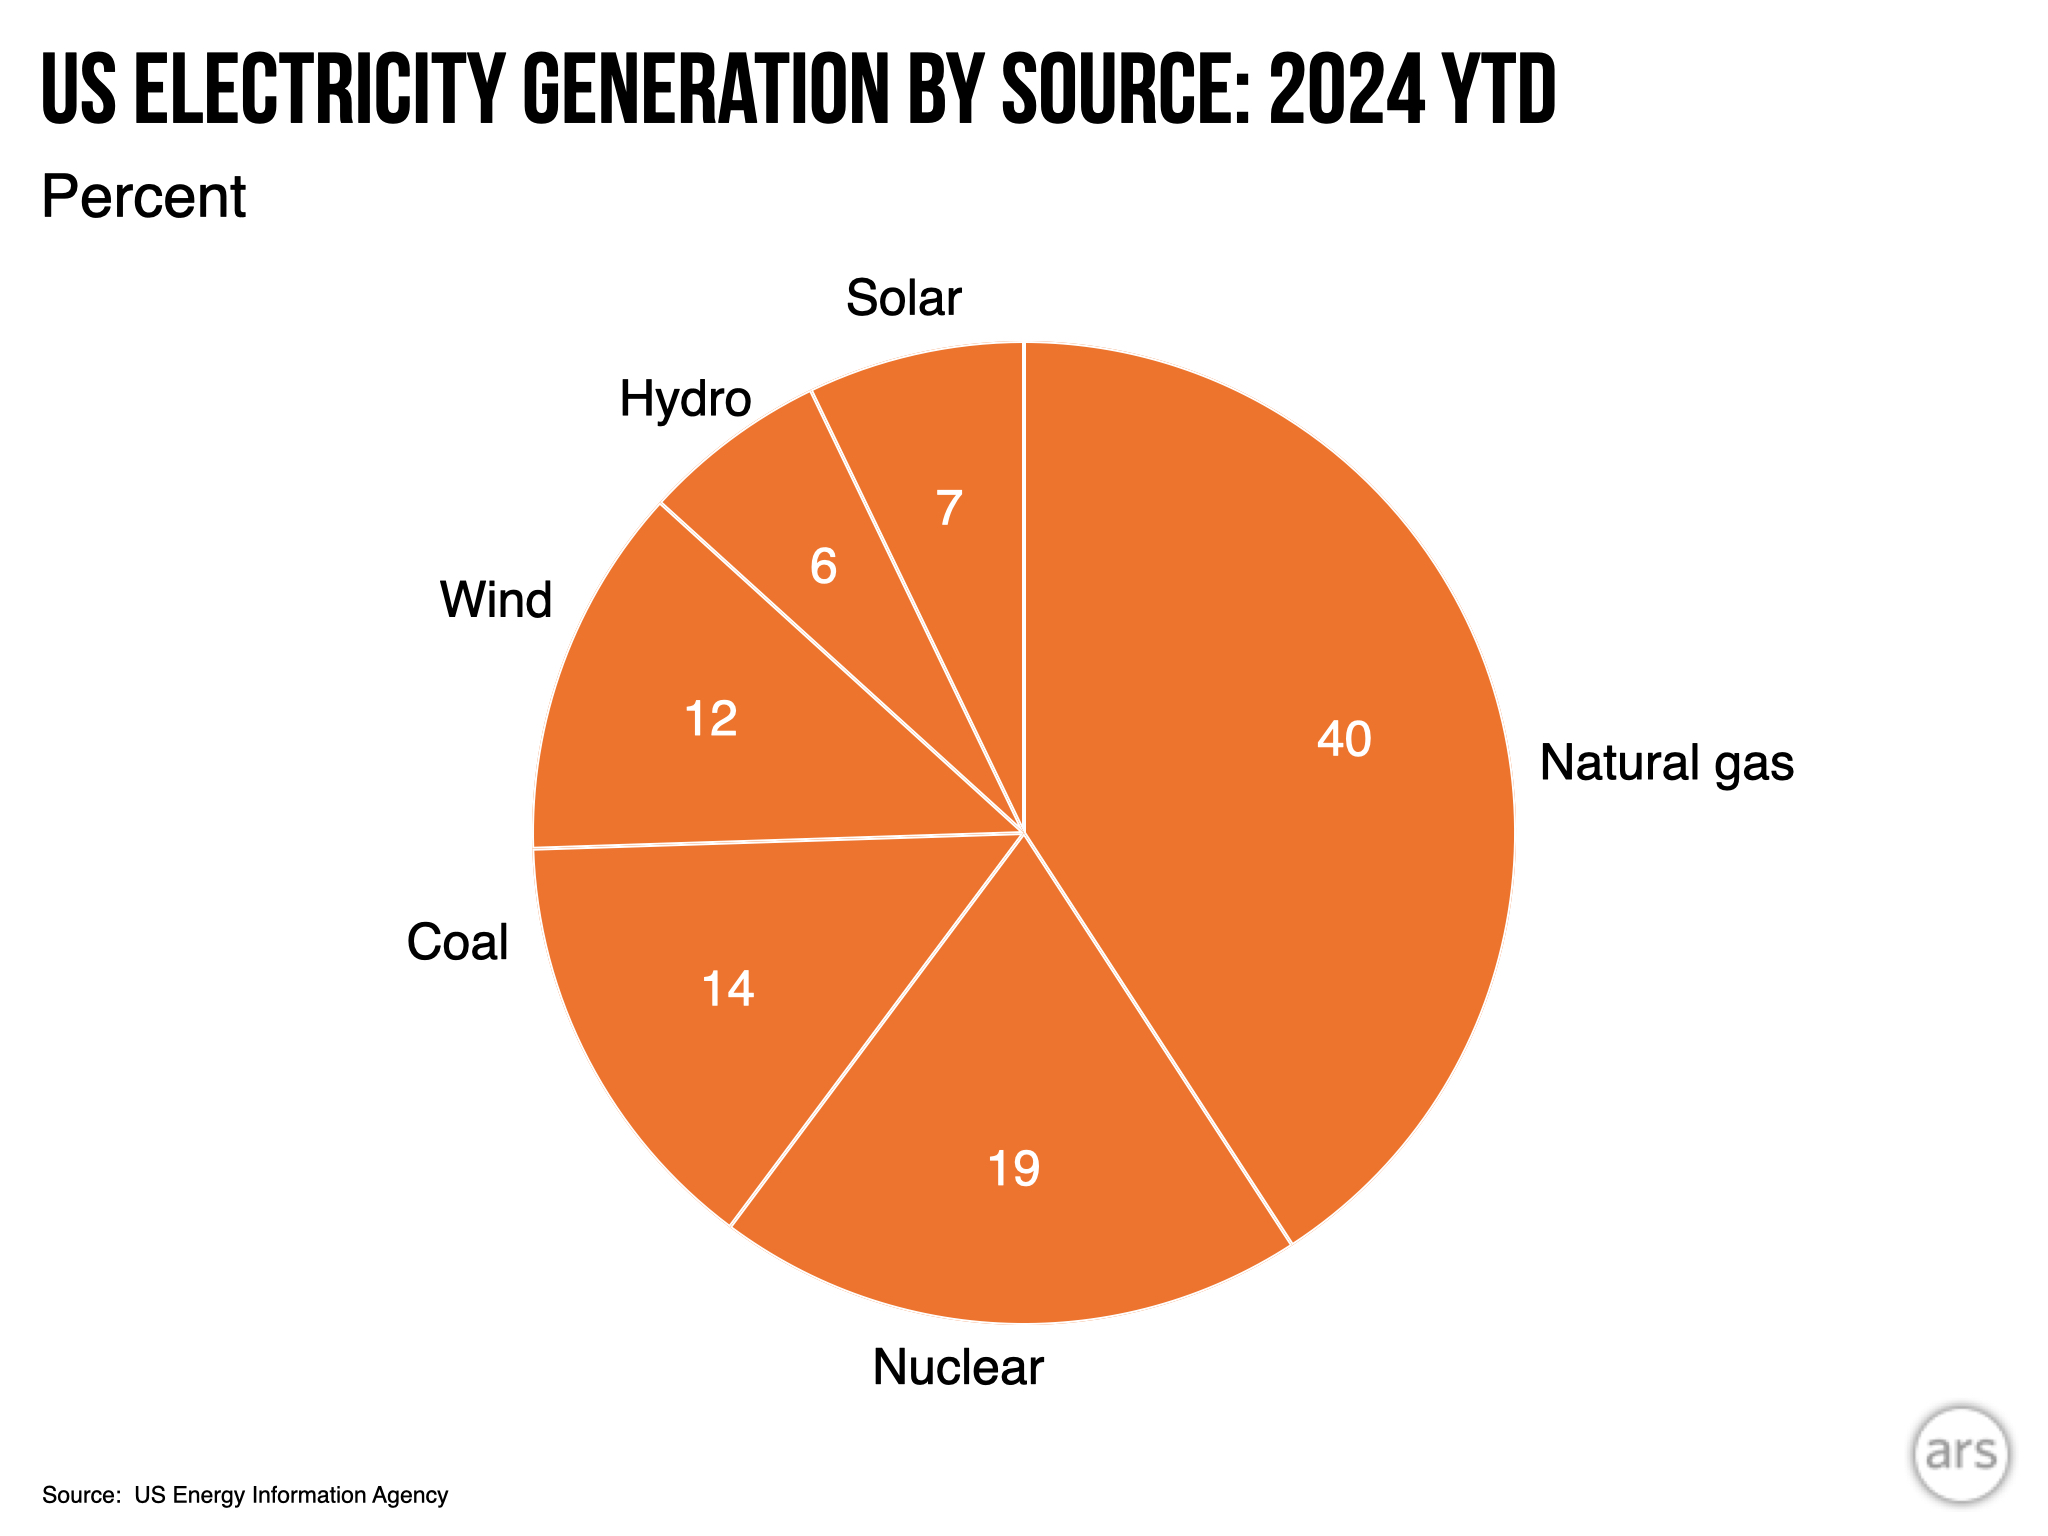
Enlarge/ US electricity sources for January through May of 2024. Note that the numbers do not add up to 100 percent due to the omission of minor contributors like geothermal and biomass.
John Timmer
Overall, energy use was up by about 4 percent compared to the same period in 2023. This could simply be a matter of changing weather conditions that require more heating or cooling. But there have been several trends that should increase electricity usage: the rise of bitcoin mining, the growth of data centers, and the electrification of appliances and transport. So far, that hasn’t shown up in the actual electricity usage in the US, which has stayed largely flat for decades. It could be possible that 2024 is the year when usage starts going up again.
More to come
It’s worth noting that this data all comes from before some of the most productive months of the year for solar power; overall, the EIA is predicting that solar production could rise by as much as 42 percent in 2024.
So, where does this leave the US’s efforts to decarbonize? If we combine nuclear, hydro, wind, and solar under the umbrella of carbon-free power sources, then these account for about 45 percent of US electricity production so far this year. Within that category, wind and solar now produce more than three times hydroelectric, and roughly the same amount as nuclear.
Wind and solar have also produced 1.3 times as much electricity as coal so far in 2024, with solar alone now producing about half as much as coal. That said, natural gas still produces twice as much electricity as wind and solar combined, indicating we still have a long way to go to decarbonize our grid.
Enlarge/ When you look at the generating facilities that will be built over the next 12 months, it’s difficult not to see a pattern.
Still, we can expect solar’s productivity to climb even before the year is out. That’s in part because we don’t yet have numbers for June, the month that contains the longest day of the year. But it’s also because the construction boom shows no sign of stopping. As noted here, solar and wind deployments are expected to dwarf everything else over the coming year. The items in gray on the map primarily represent battery storage, which will allow us to make better use of those renewables, as well.
By contrast, facilities that are scheduled for retirement over the next year largely consist of coal and natural gas plants.
Enlarge/ Tires are a growing source of microplastic pollution. Michelin says it wants to change that.
Getty Images
Reduce, Reuse, Recycle—it’s more than just a fun alliteration tagline. It’s also a set of instructions for how to consume in a way that’s less destructive to our environment. We reduce our consumption and reuse what we already have, then recycle it once it no longer has any use. Unfortunately, many are going straight to recycling and calling it a day.
At its sustainability summit in Northern California at the Sonoma Raceway, Michelin laid out a new roadmap for its plans to become a more sustainable company. Most importantly, the company shared what it’s been doing for decades to reduce the harm done to the world by its tires.
The company reiterated its desire to have 100 percent renewable tires by 2050. Companies make a lot of pronouncements like this, and they only sometimes come to fruition. But looking at Michelin’s present efforts and past record, the company has a decent chance of succeeding.
The now
Michelin currently has a demonstration tire made of 42 percent renewable materials. The company has plenty of time to reach its goal in 2050, so it’s trying to make the change in the most profitable way possible.
“We are guided by a sustainable world view of organizing principles that is in every business decision we make. We balance it across three domains: the people, the planet, the profits,” Michelin North America President and CEO Alexis Garcin said during a presentation.
The “People, Planet, Profit” principles emphasize eco-consciousness but also remind everyone that Michelin is a company that needs to make money to keep tires rolling off the lines.
During the event, Michelin said that its research into more sustainable tires requires teams to show that the materials they use are readily available and that the tire can be produced at scale. This is a vast improvement over companies that unveil unrealistic, feel-good items that won’t ever see production.
The then
In 1992, Michelin introduced its first fuel-efficient tire. It had a lower rolling resistance, allowing drivers to potentially save money on gas and reduce their carbon footprint (although, to be fair, most probably didn’t think about that).
The company has been stress-testing the stuff that goes into tires, too. In 2019, it introduced new racing tires for IMSA’s WeatherTech Sportscar Championship that used 30 percent renewable and recycled materials, with no real drop-off in performance.
There’s also the reputation for longevity. According to a 2023 study by the German ADAC (Allgemeiner Deutscher Automobil-Club—think Germany’s AAA), Michelin’s average tire abrasion rate was 28 percent lower than the rate in average tires from other brands on the road in Germany.
The abrasion rate is how much of the tire is shed while driving. The higher the abrasion rate, the more particulates are left on the asphalt, which migrate to the soil and eventually end up in the water supply. Much has been said about these particles that have permeated our environment, little of it good.
Tires are a major source of microplastics, and as our vehicles get larger and heavier due to an insatiable appetite for large vehicles and our transition to EVs, tire companies have a spotlight on them to reduce their product abrasion rates. Here, Michelin seems to be ahead of the curve.
The later
Eighty percent of a tire’s environmental impact comes from the time that it’s sitting on a vehicle. Building a more sustainable tire can’t be done by just relying on different materials, especially if those materials wear down quicker than what’s already on the road. Michelin’s lifecycle assessment looks at the cradle-to-grave impact of a product as an ecosystem.
“For us, it’s people, profit, planet. We care about all of them at the same time with the same intensity, and that’s how we think we’re going to be sustainable,” Garcin said. If the company keeps sight of the goal, it might just pull it off.
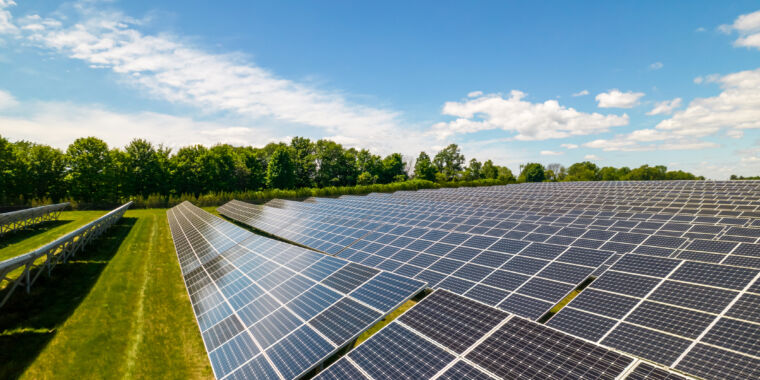
One of the most striking things about the explosion of renewable power that’s happening in the US is that much of it is going on in states governed by politicians who don’t believe in the problem wind and solar are meant to address. Acceptance of the evidence for climate change tends to be lowest among Republicans, yet many of the states where renewable power has boomed—wind in Wyoming and Iowa, solar in Texas—are governed by Republicans.
That’s partly because, up until about 2020, there was a strong bipartisan consensus in favor of expanding wind and solar power, with support above 75 percent among both parties. Since then, however, support among Republicans has dropped dramatically, approaching 50 percent, according to polling data released this week.
Renewables enjoyed solid Republican support until recently.
To a certain extent, none of this should be surprising. The current leader of the Republican Party has been saying that wind turbines cause cancer and offshore wind is killing whales. And conservative-backed groups have been spreading misinformation in order to drum up opposition to solar power facilities.
Meanwhile, since 2022, the Inflation Reduction Act has been promoted as one of the Biden administration’s signature accomplishments and has driven significant investments in renewable power, much of it in red states. Negative partisanship is undoubtedly contributing to this drop in support.
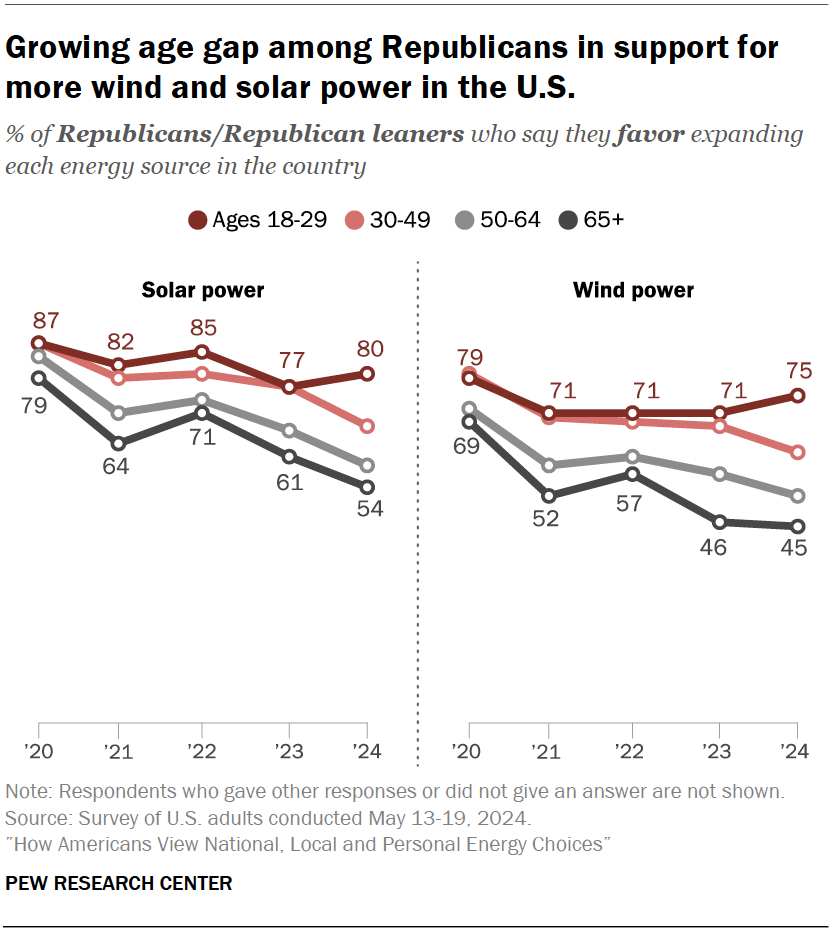
One striking thing about the new polling data, gathered by the Pew Research Center, is how dramatically it skews with age. When given a choice between expanding fossil fuel production or expanding renewable power, Republicans under the age of 30 favored renewables by a 2-to-1 margin. Republicans over 30, in contrast, favored fossil fuels by margins that increased with age, topping out at a three-to-one margin in favor of fossil fuels among those in the 65-and-over age group. The decline in support occurred in those over 50 starting in 2020; support held steady among younger groups until 2024, when the 30–49 age group started moving in favor of fossil fuels.
Among younger Republicans, support for renewable energy remains high.
Democrats, by contrast, break in favor of renewables by 75 points, with little difference across age groups and no indication of significant change over time. They’re also twice as likely to think a solar farm will help the local economy than Republicans are.
Similar differences were apparent when Pew asked about policies meant to encourage the sale of electric vehicles, with 83 percent of Republicans opposed to having half of cars sold be electric in 2032. By contrast, nearly two-thirds of Democrats favored this policy.
There’s also a rural/urban divide apparent (consistent with Republicans getting more support from rural voters). Forty percent of urban residents felt that a solar farm would improve the local economy; only 25 percent of rural residents agreed. Rural residents were also more likely to say solar farms made the landscape unattractive and take up too much space. (Suburban participants were consistently in between rural and urban participants.)
What’s behind these changes? The single biggest factor appears to be negative partisanship combined with the election of Joe Biden.
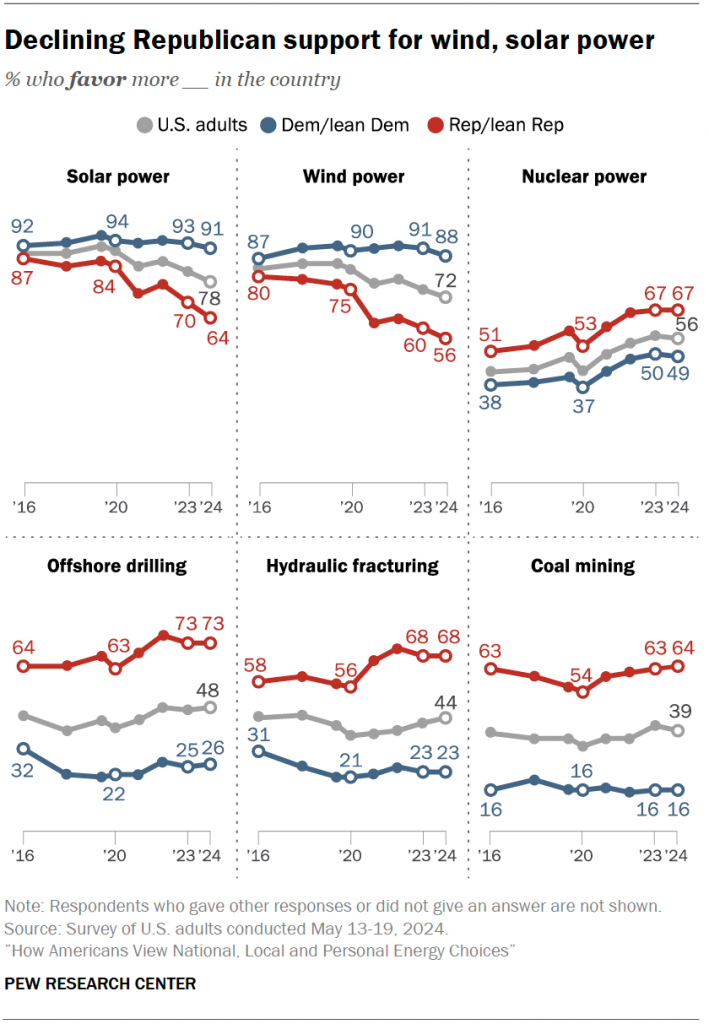
For Republicans, 2020 represented an inflection point in terms of support for different types of energy. That wasn’t true for Democrats.
Among Republicans, support for every single form of power started to change in 2020—fossil fuels, renewables, and nuclear. Among Democrats, that’s largely untrue. Their high level of support for renewable power and aversion to fossil fuels remained largely unchanged. The lone exception is nuclear power, where support rose among both Democrats and Republicans (the Biden administration has adopted a number of pro-nuclear policies).
This isn’t to say that non-political factors are playing no role. The rapid expansion of renewable power means that many more people are seeing facilities open near them, and viewing that as an indication of a changing society. Some degree of backlash was almost inevitable and, in this case, the close ties between conservative lobbyists and fossil fuel interests were ready to take advantage of it.
Enlarge/ Some of the waste material that ends up part of these bricks.
Seamus Daniel, RMIT University
Researchers at the Royal Melbourne Institute of Technology (RMIT) in Australia have developed special “energy-smart bricks” that can be made by mixing clay with glass waste and coal ash. These bricks can help mitigate the negative effects of traditional brick manufacturing, an energy-intensive process that requires large-scale clay mining, contributes heavily to CO2 emissions, and generates a lot of air pollution.
According to the RMIT researchers, “Brick kilns worldwide consume 375 million tonnes (~340 million metric tons) of coal in combustion annually, which is equivalent to 675 million tonnes of CO2 emission (~612 million metric tons).” This exceeds the combined annual carbon dioxide emissions of 130 million passenger vehicles in the US.
The energy-smart bricks rely on a material called RCF waste. It mostly contains fine pieces of glass (92 percent) left over from the recycling process, along with ceramic materials, plastic, paper, and ash. Most of this waste material generally ends up in landfills, where it can cause soil and water degradation. However, the study authors note, “The utilization of RCF waste in fired-clay bricks offers a potential solution to the increasing global waste crisis and reduces the burden on landfills.”
What makes the bricks “energy-smart”
Compared to traditional bricks, the newly developed energy-smart bricks have lower thermal conductivity: They retain heat longer and undergo more uniform heating. This means they can be manufactured at lower firing temperatures. For instance, while regular clay bricks are fired (a process during which bricks are baked in a kiln, so they become hard and durable) at 1,050° C, energy-smart bricks can achieve the required hardness at 950° C, saving 20 percent of the energy needed for traditional brickmaking.
Based on bricks produced in their lab, they estimated that “each firing cycle led to a potential value of up to $158,460 through a reduction of 417 tonnes of CO2, resulting from a 9.5 percent reduction in firing temperature.” So basically, if a manufacturer switches from regular clay bricks to energy-smart bricks, it will end up saving thousands of dollars on its power bill, and its kilns will release less CO2 into Earth’s atmosphere. Scaled up to the estimated 1.4 trillion bricks made each year, the savings are substantial.
But brick manufacturers aren’t the only ones who benefit. “Bricks characterized by low thermal conductivity contribute to efficient heat storage and absorption, creating a cooler environment during summer and a warmer comfort during winter. This advantage translates into energy savings for air conditioning, benefiting the occupants of the house or building,” the study authors explained.
Tests conducted by the researchers suggest that the residents of a single-story house built using energy-smart bricks will save up to 5 percent on their energy bills compared to those living in a house made with regular clay bricks.


