Mathematicians finally solved Feynman’s “reverse sprinkler” problem
A decades-old conundrum —
We might not need to “unwater” our lawns, but results could help control fluid flows.
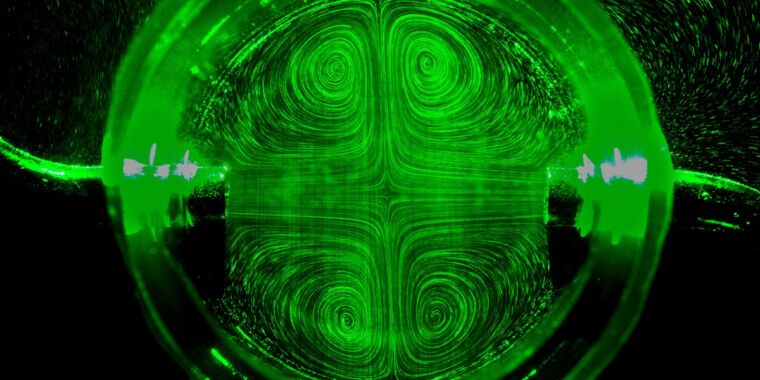
Light-scattering microparticles reveal the flow pattern for the reverse (sucking) mode of a sprinkler, showing vortices and complex flow patterns forming inside the central chamber. Credit: K. Wang et al., 2024
A typical lawn sprinkler features various nozzles arranged at angles on a rotating wheel; when water is pumped in, they release jets that cause the wheel to rotate. But what would happen if the water were sucked into the sprinkler instead? In which direction would the wheel turn then, or would it even turn at all? That’s the essence of the “reverse sprinkler” problem that physicists like Richard Feynman, among others, have grappled with since the 1940s. Now, applied mathematicians at New York University think they’ve cracked the conundrum, per a recent paper published in the journal Physical Review Letters—and the answer challenges conventional wisdom on the matter.
“Our study solves the problem by combining precision lab experiments with mathematical modeling that explains how a reverse sprinkler operates,” said co-author Leif Ristroph of NYU’s Courant Institute. “We found that the reverse sprinkler spins in the ‘reverse’ or opposite direction when taking in water as it does when ejecting it, and the cause is subtle and surprising.”
Ristroph’s lab frequently addresses these kinds of colorful real-world puzzles. For instance, back in 2018, Ristroph and colleagues fine-tuned the recipe for the perfect bubble based on experiments with soapy thin films. (You want a circular wand with a 1.5-inch perimeter, and you should gently blow at a consistent 6.9 cm/s.) In 2021, the Ristroph lab looked into the formation processes underlying so-called “stone forests” common in certain regions of China and Madagascar. These pointed rock formations, like the famed Stone Forest in China’s Yunnan Province, are the result of solids dissolving into liquids in the presence of gravity, which produces natural convective flows.
In 2021, his lab built a working Tesla valve, in accordance with the inventor’s design, and measured the flow of water through the valve in both directions at various pressures. They found the water flowed about two times slower in the nonpreferred direction. And in 2022, Ristroph studied the surpassingly complex aerodynamics of what makes a good paper airplane—specifically what is needed for smooth gliding. They found that paper airplane aerodynamics differ substantially from conventional aircraft, which rely on airfoils to generate lift.
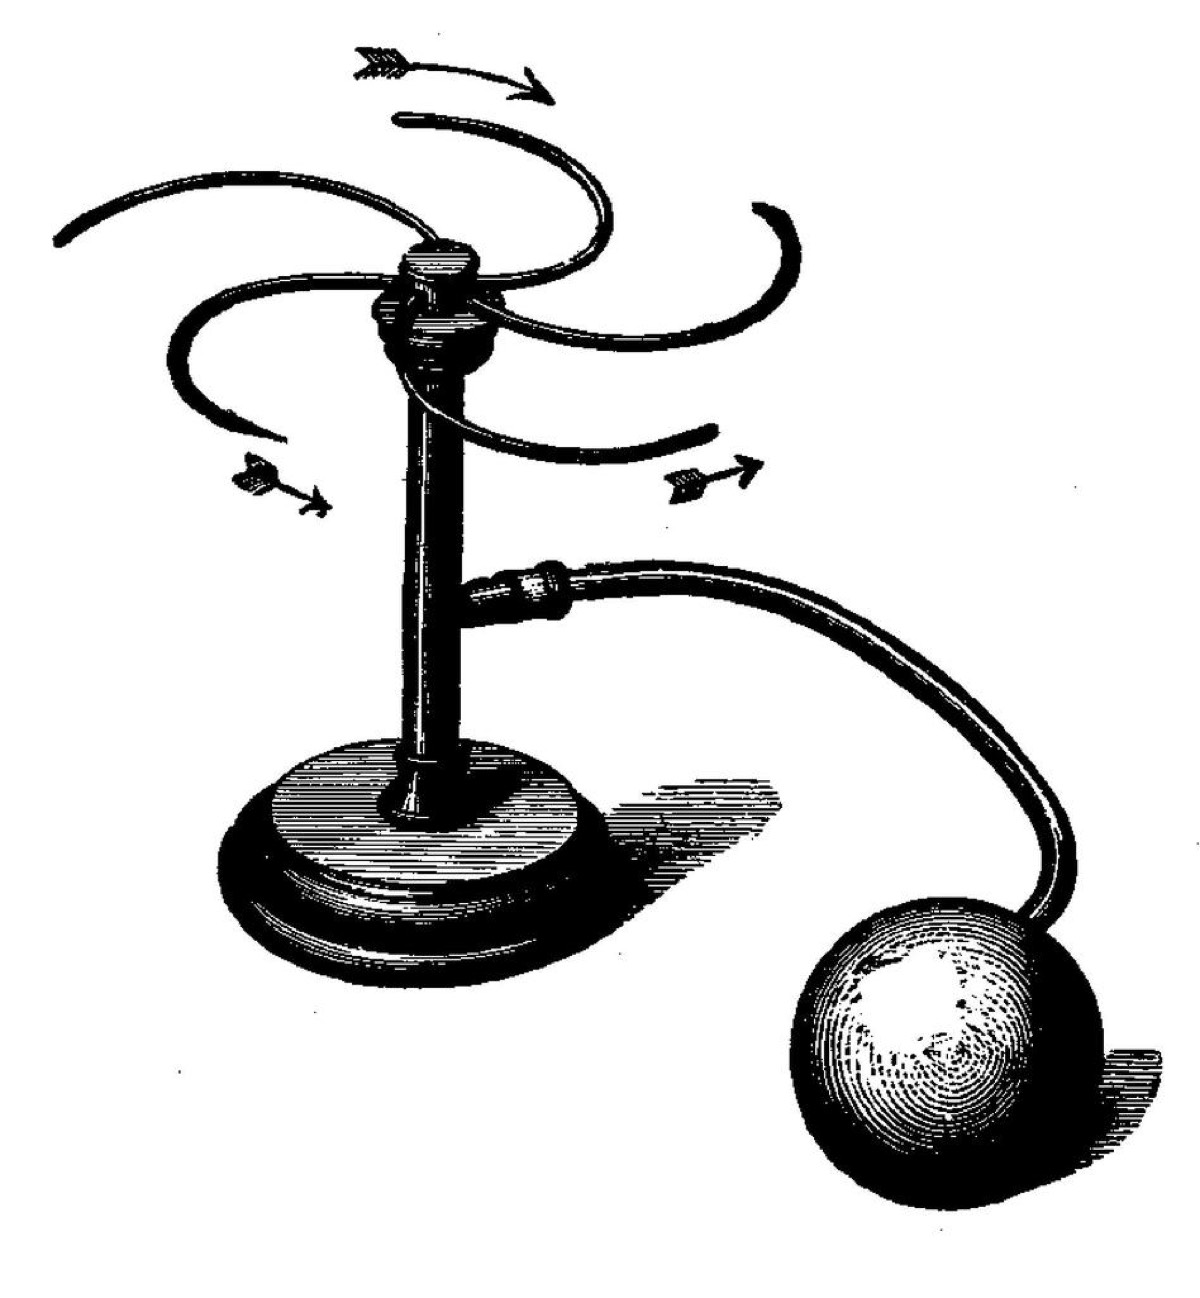
Enlarge / Illustration of a “reaction wheel” from Ernst Mach’s Mechanik (1883).
Public domain
The reverse sprinkler problem is associated with Feynman because he popularized the concept, but it actually dates back to a chapter in Ernst Mach’s 1883 textbook The Science of Mechanics (Die Mechanik in Ihrer Entwicklung Historisch-Kritisch Dargerstellt). Mach’s thought experiment languished in relative obscurity until a group of Princeton University physicists began debating the issue in the 1940s.
Feynman was a graduate student there at the time and threw himself into the debate with gusto, even devising an experiment in the cyclotron laboratory to test his hypothesis. (In true Feynman fashion, that experiment culminated with the explosion of a glass carboy used in the apparatus because of the high internal pressure.)
One might intuit that a reverse sprinkler would work just like a regular sprinkler, merely played backward, so to speak. But the physics turns out to be more complicated. “The answer is perfectly clear at first sight,” Feynman wrote in Surely You’re Joking, Mr. Feynman (1985). “The trouble was, some guy would think it was perfectly clear [that the rotation would be] one way, and another guy would think it was perfectly clear the other way.”
Mathematicians finally solved Feynman’s “reverse sprinkler” problem Read More »


