A fluid can store solar energy and then release it as heat months later
Sunlight can cause a molecule to change structure, and then release heat later.
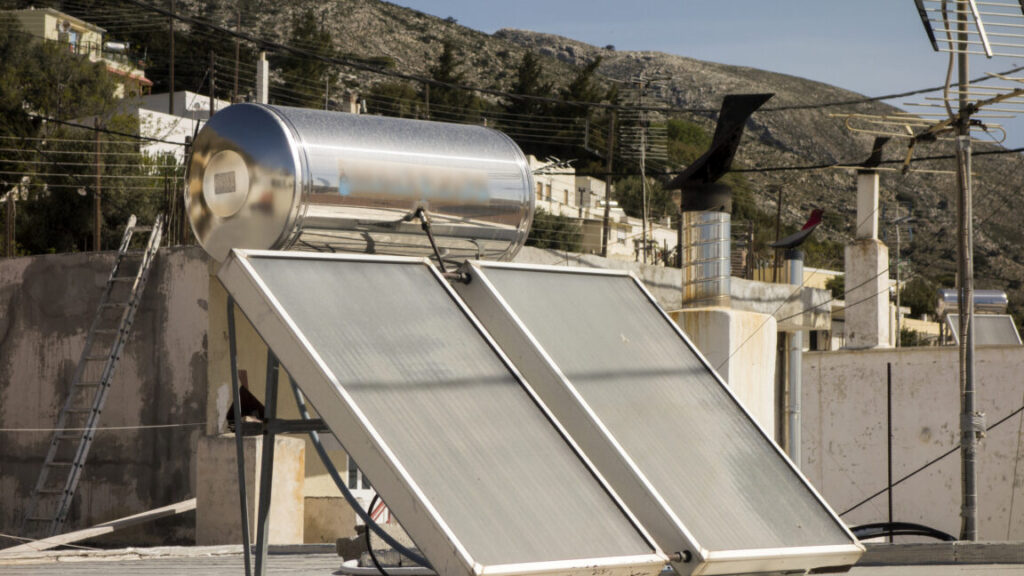
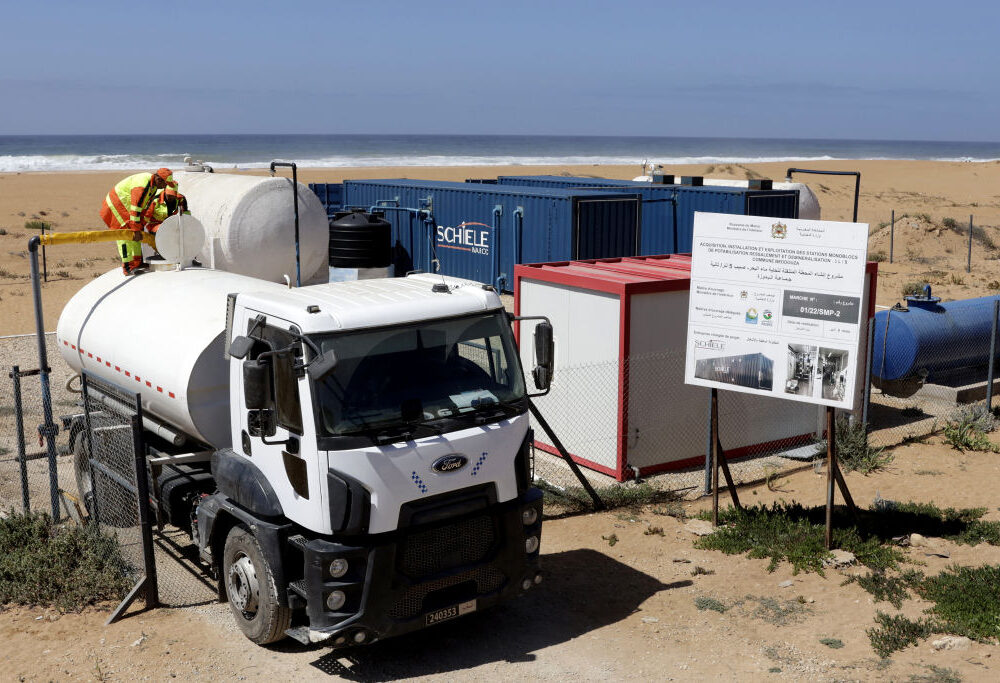
The system works a bit like existing solar water heaters, but with chemical heat storage. Credit: Kypros
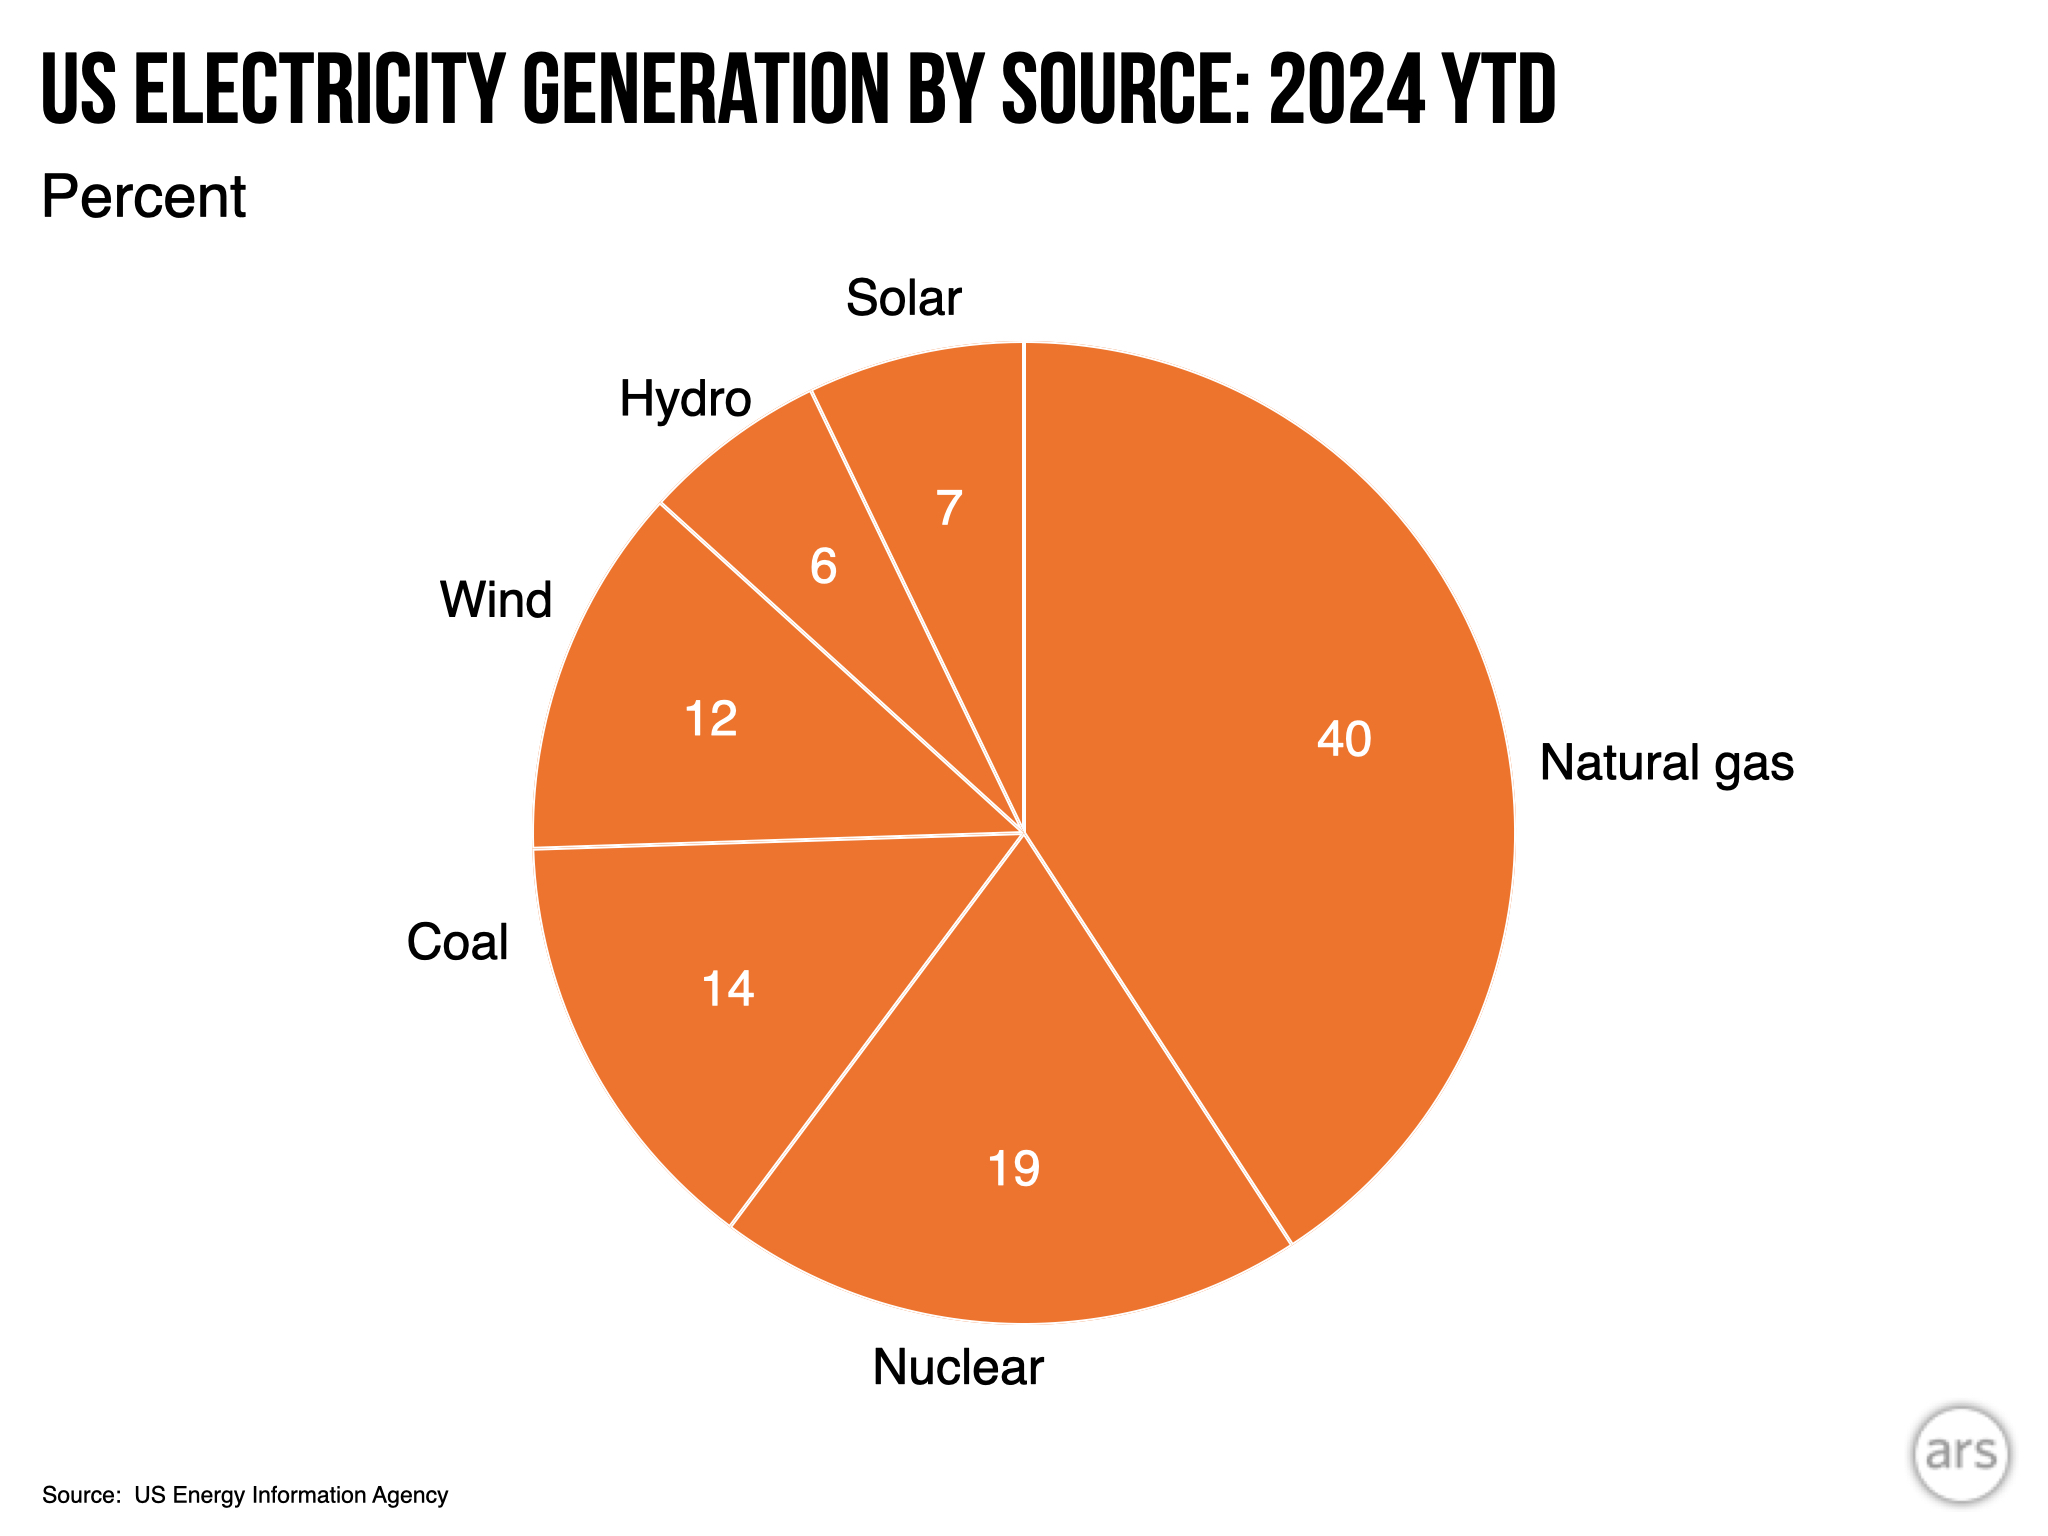
Heating accounts for nearly half of the global energy demand, and two-thirds of that is met by burning fossil fuels like natural gas, oil, and coal. Solar energy is a possible alternative, but while we have become reasonably good at storing solar electricity in lithium-ion batteries, we’re not nearly as good at storing heat.
To store heat for days, weeks, or months, you need to trap the energy in the bonds of a molecule that can later release heat on demand. The approach to this particular chemistry problem is called molecular solar thermal (MOST) energy storage. While it has been the next big thing for decades, it never really took off.
In a recent Science paper, a team of researchers from the University of California, Santa Barbara, and UCLA demonstrate a breakthrough that might finally make MOST energy storage effective.
The DNA connection
In the past, MOST energy storage solutions have been plagued by lackluster performance. The molecules either didn’t store enough energy, degraded too quickly, or required toxic solvents that made them impractical. To find a way around these issues, the team led by Han P. Nguyen, a chemist at the University of California, Santa Barbara, drew inspiration from the genetic damage caused by sunburn. The idea was to store energy using a reaction similar to the one that allows UV light to damage DNA.
When you stay out on the beach too long, high-energy ultraviolet light can cause adjacent bases in the DNA (thymine, the T in the genetic code) to link together. This forms a structure known as a (6-4) lesion. When that lesion is exposed to even more UV light, it twists into an even stranger shape called a “Dewar” isomer. In biology, this is rather bad news, as Dewar isomers cause kinks in the DNA’s double-helix spiral that disrupt copying the DNA and can lead to mutations or cancer.
To counter this effect, evolution shaped a specific enzyme called photolyase to hunt (6-4) lesions down and snap them back into their safe, stable forms.
The researchers realized that the Dewar isomer is essentially a molecular battery. This snap-back effect was exactly what Nguyen’s team was looking for, since it releases a lot of heat.
Rechargeable fuel
Molecular batteries, in principle, are extremely good at storing energy. Heating oil, arguably the most popular molecular battery we use for heating, is essentially ancient solar energy stored in chemical bonds. Its energy density stands at around 40 Megajoules per kilo. To put that in perspective, Li-ion batteries usually pack less than one MJ/kg. One of the problems with heating oil, though, is that it is single-use only—it gets burnt when you use it. What Nguyen and her colleagues aimed to achieve with their DNA-inspired substance is essentially a reusable fuel.
To do that, researchers synthesized a derivative of 2-pyrimidone, a chemical cousin of the thymine found in DNA. They engineered this molecule to reliably fold into a Dewar isomer under sunlight and then unfold on command. The result was a rechargeable fuel that could absorb the energy when exposed to sunlight, release it when needed, and return to a “relaxed” state where it’s ready to be charged up again.
Previous attempts at MOST systems have struggled to compete with Li-ion batteries. Norbornadiene, one of the best-studied candidates, tops out at around 0.97 MJ/kg. Another contender, azaborinine, manages only 0.65 MJ/kg. They may be scientifically interesting, but they are not going to heat your house.
Nguyen’s pyrimidone-based system blew those numbers out of the water. The researchers achieved an energy storage density of 1.65 MJ/kg—nearly double the capacity of Li-ion batteries and substantially higher than any previous MOST material.
Double rings
The reason for this jump in performance was what the team called compounded strain.
When the pyrimidone molecule absorbs light, it doesn’t just fold; it twists into a fused, bicyclic structure containing two different four-membered rings: 1,2-dihydroazete and diazetidine. Four-membered rings are under immense structural tension. By fusing them together, the researchers created a molecule that is desperate to snap back into its relaxed state.
Achieving high energy density on paper is one thing. Making it work in the real world is another. A major failing of previous MOST systems is that they are solids that need to be dissolved in solvents like toluene or acetonitrile to work. Solvents are the enemy of energy density—by diluting your fuel to 10 percent concentration, for example, you effectively cut your energy density by 90 percent. Any solvent used means less fuel.
Nguyen’s team tackled this by designing a version of their molecule that is a liquid at room temperature, so it doesn’t need a solvent. This simplified operations considerably, as the liquid fuel could be pumped through a solar collector to charge it up and store it in a tank.
Unlike many organic molecules that hate water, Nguyen’s system is compatible with aqueous environments. This means if a pipe leaks, you aren’t spewing toxic fluids like toluene around your house. The researchers even demonstrated that the molecule could work in water and that its energy release was intense enough to boil it.
The MOST-based heating system, the team says in their paper, would circulate this rechargeable fuel through panels on the roof to capture the sun’s light and then store it in the basement tank. The fuel from this tank would later be pumped to a reaction chamber with an acid catalyst that triggers the energy release. Then, through a heat exchanger, this energy would heat up the water in the standard central heating system.
But there’s a catch.
Looking for the leak
The first hurdle is the spectrum of light that puts energy in the Nguyen’s fuel. The Sun bathes us in a broad spectrum of light, from infrared to ultraviolet. Ideally, a solar collector should use as much of this as possible, but the pyrimidone molecules only absorb light in the UV-A and UV-B range, around 300-310 nm. That represents about five percent of the total solar spectrum. The vast majority of the Sun’s energy, the visible light and the infrared, passes right through Nguyen’s molecules without charging them.
The second problem is quantum yield. This is a fancy way of asking, “For every 100 photons that hit the molecule, how many actually make it switch to the Dewar isomer state?” For these pyrimidones, the answer is a rather underwhelming number, in the single digits. Low quantum yield means the fluid needs a longer exposure to sunlight to get a full charge.
The researchers hypothesize that the molecule has a fast leak, meaning a non-radiative decay path where the excited molecule shakes off the energy as heat immediately instead of twisting into the storage form. Plugging that leak is the next big challenge for the team.
Finally, the team in their experiments used an acid catalyst that was mixed directly into the storage material. The team admits that in a future closed-loop device, this would require a neutralization step—a reaction that eliminates the acidity after the heat is released. Unless the reaction products can be purified away, this will reduce the energy density of the system.
Still, despite the efficiency issues, the stability of the Nguyen’s system looks promising.
The MOST storage?
One of the biggest fears with chemical storage is thermal reversion—the fuel spontaneously discharges because it got a little too warm in the storage tank. But the Dewar isomers of the pyrimidones are incredibly stable. The researchers calculated a half-life of up to 481 days at room temperature for some derivatives. This means the fuel could be charged in the heat of July, and it would remain fully charged when you need to heat your home in January. The degradation figures also look decent for a MOST energy storage. The team ran the system through 20 charge-discharge cycles with negligible decay.
The problem with separating the acid from the fuel could be solved in a practical system by switching to a different catalyst. The scientists suggest in the paper that in this hypothetical setup, the fuel would flow through an acid-functionalized solid surface to release heat, thus eliminating the need for neutralization afterwards.
Still, we’re rather far away using MOST systems for heating actual homes. To get there, we’re going to need molecules that absorb far more of the light spectrum and convert to the activated state with a higher efficiency. We’re just not there yet.
Science, 2026. DOI: 10.1126/science.aec6413

Jacek Krywko is a freelance science and technology writer who covers space exploration, artificial intelligence research, computer science, and all sorts of engineering wizardry.
A fluid can store solar energy and then release it as heat months later Read More »


