New quantum hardware puts the mechanics in quantum mechanics
As a test case, the machine was used to test a model of superconductivity.
Quantum computers based on ions or atoms have one major advantage: The hardware itself isn’t manufactured, so there’s no device-to-device variability. Every atom is the same and should perform similarly every time. And since the qubits themselves can be moved around, it’s theoretically possible to entangle any atom or ion with any other in the system, allowing for a lot of flexibility in how algorithms and error correction are performed.
This combination of consistent, high-fidelity performance with all-to-all connectivity has led many key demonstrations of quantum computing to be done on trapped-ion hardware. Unfortunately, the hardware has been held back a bit by relatively low qubit counts—a few dozen compared to the hundred or more seen in other technologies. But on Wednesday, a company called Quantinuum announced a new version of its trapped-ion hardware that significantly boosts the qubit count and uses some interesting technology to manage their operation.
Trapped-ion computing
Both neutral atom and trapped-ion computers store their qubits in the spin of the nucleus. That spin is somewhat shielded from the environment by the cloud of electrons around the nucleus, giving these qubits a relatively long coherence time. While neutral atoms are held in place by a network of lasers, trapped ions are manipulated via electromagnetic control based on the ion’s charge. This means that key components of the hardware can be built using standard electronic manufacturing, although lasers are still needed for manipulations and readout.
While the electronics are static—they stay wherever they were manufactured—they can be used to move the ions around. That means that as long as the trackways the atoms can move on enable it, any two ions can be brought into close proximity and entangled. This all-to-all connectivity can enable more efficient implementation of algorithms performed directly on the hardware qubits or the use of error-correction codes that require a complicated geometry of connections. That’s one reason why Microsoft used a Quantinuum machine to demonstrate error-correction code based on a tesseract.
But arranging the trackways so that any two qubits can be next to each other can become increasingly complicated. Moving ions around is a relatively slow process, so retrieving two ions from the far ends of a chip too often can cause a system to start pushing up against the coherence time of the qubits. In the long term, Quantinuum plans to build chips with a square grid reminiscent of the street layout of many cities. But doing so will require a mastery of controlling the flow of ions through four-way intersections.
And that’s what Quantinuum is doing in part with its new chip, named Helios. It has a single intersection that couples two ion-storage areas, enabling operations as ions slosh from one end of the chip to the other. And it comes with significantly more qubits than its earlier hardware, moving from 56 to 96 qubits without sacrificing performance. “We’ve kept and actually even improved the two qubit gate fidelity,” Quantinuum VP Jenni Strabley told Ars. “So we’re not seeing any degradation in the two-qubit gate fidelity as we go to larger and larger sizes.”
Doing the loop
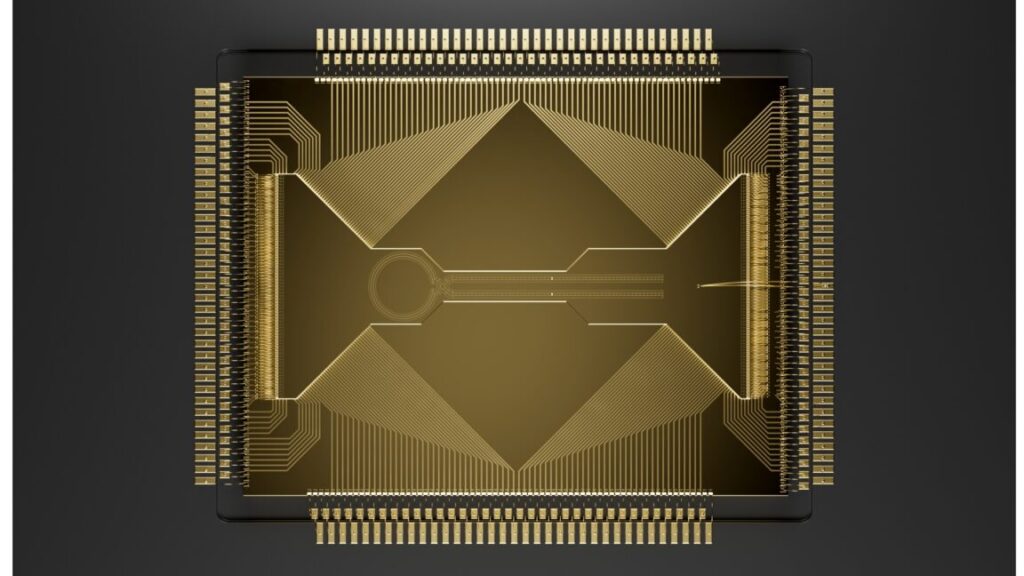
The image below is taken using the fluorescence of the atoms in the hardware itself. As you can see, the layout is dominated by two features: A loop at the left and two legs extending to the right. They’re connected by a four-way intersection. The Quantinuum staff described this intersection as being central to the computer’s operation.
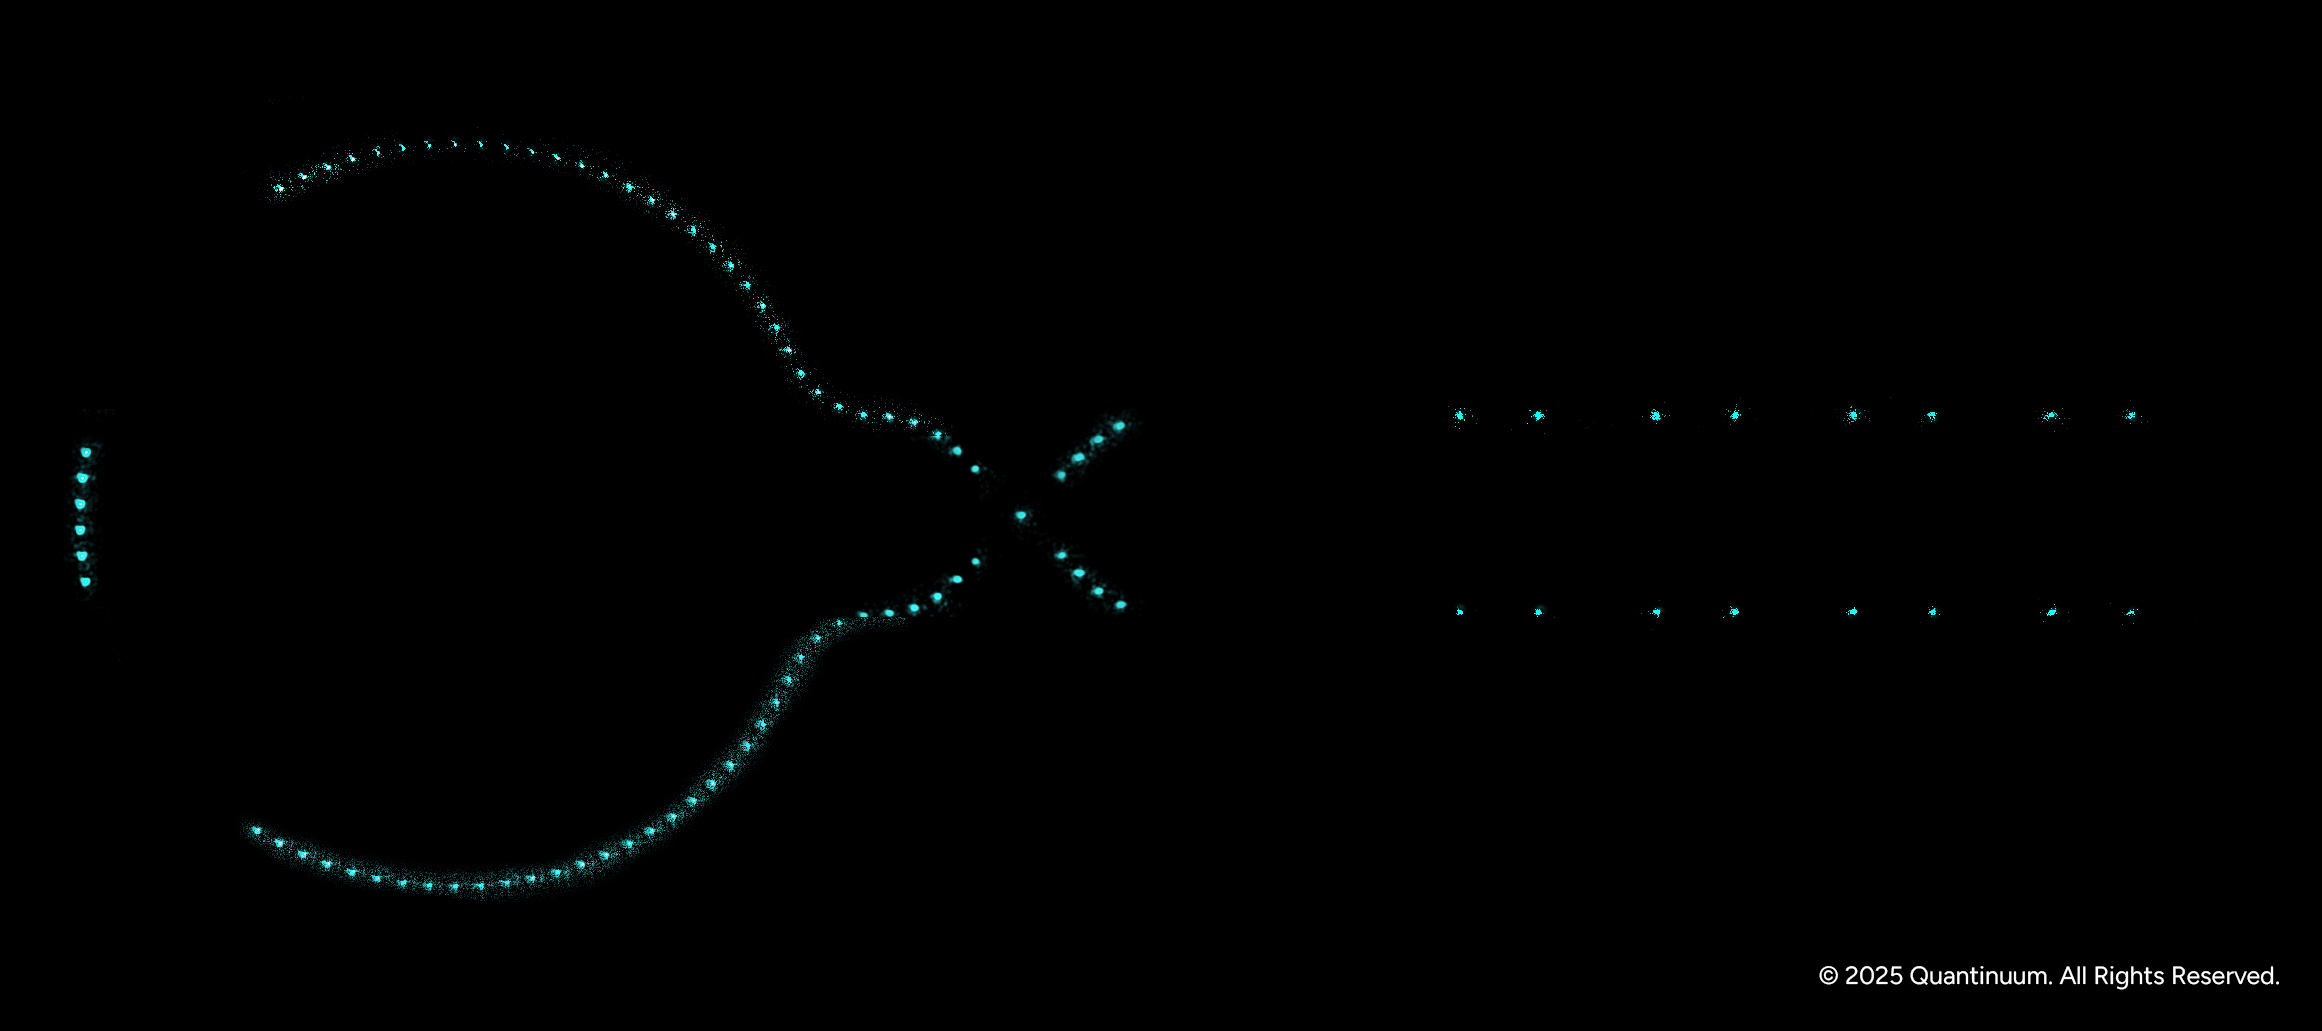
The actual ions trace out the physical layout of the Helios system, featuring a storage ring and two legs that contain dedicated operation sites. Credit: Quantinuum
The system works by rotating the ions around the loop. As an ion reaches the intersection, the system chooses whether to kick it into one of the legs and, if so, which leg. “We spin that ring almost like a hard drive, really, and whenever the ion that we want to gate gets close to the junction, there’s a decision that happens: Either that ion goes [into the legs], or it kind of makes a little turn and goes back into the ring,” said David Hayes, Quantinuum’s director of Computational Design and Theory. “And you can make that decision with just a few electrodes that are right at that X there.”
Each leg has a region where operations can take place, so this system can ensure that the right qubits are present together in the operation zones for things like two-qubit gates. Once the operations are complete, the qubits can be moved into the leg storage regions, and new qubits can be shuffled in. When the legs fill up, the qubits can be sent back to the loop, and the process is restarted.
“You get less traffic jams if all the traffic is running one way going through the gate zones,” Hayes told Ars. “If you had to move them past each other, you would have to do kind of physical swaps, and you want to avoid that.”
Obviously, issuing all the commands to control the hardware will be quite challenging for anything but the simplest operations. That puts an increasing emphasis on the compilers that add a significant layer of abstraction between what you want a quantum computer to do and the actual hardware commands needed to implement it. Quantinuum has developed its own compiler to take user-generated code and produce something that the control system can convert into the sequence of commands needed.
The control system now incorporates a real-time engine that can read data from Helios and update the commands it issues based on the state of the qubits. Quantinuum has this portion of the system running on GPUs rather than requiring customized hardware.
Quantinuum’s SDK for users is called Guppy and is based on Python, which has been modified to allow users to describe what they’d like the system to do. Helios is being accompanied by a new version of Guppy that includes some traditional programming tools like FOR loops and IF-based conditionals. These will be critical for the sorts of things we want to do as we move toward error-corrected qubits. This includes testing for errors, fixing them if they’re present, or repeatedly attempting initialization until it succeeds without error.
Hayes said the new version is also moving toward error correction. Thanks to Guppy’s ability to dynamically reassign qubits, Helios will be able to operate as a machine with 94 qubits while detecting errors on any of them. Alternatively, the 96 hardware qubits can be configured as a single unit that hosts 48 error-corrected qubits. “It’s actually a concatenated code,” Hayes told Ars. “You take two error detection codes and weave them together… it’s a single code block, but it has 48 logical cubits housed inside of it.” (Hayes said it’s a distance-four code, meaning it can fix up to two errors that occur simultaneously.)
Tackling superconductivity
While Quantinuum hardware has always had low error rates relative to most of its competitors, there was only so much you could do with 56 qubits. With 96 now at their disposal, researchers at the company decided to build a quantum implementation of a model (called the Fermi-Hubbard model) that’s meant to help study the electron pairing that takes place during the transition to superconductivity.
“There are definitely terms that the model doesn’t capture,” Quantinuum’s Henrik Dreyer acknowledged. “They neglect their electrorepulsion that [the electrons] still have—I mean, they’re still negatively charged; they are still repelling. There are definitely terms that the model doesn’t capture. On the other hand, I should say that this Fermi-Hubbard model—it has many of the features that a superconductor has.”
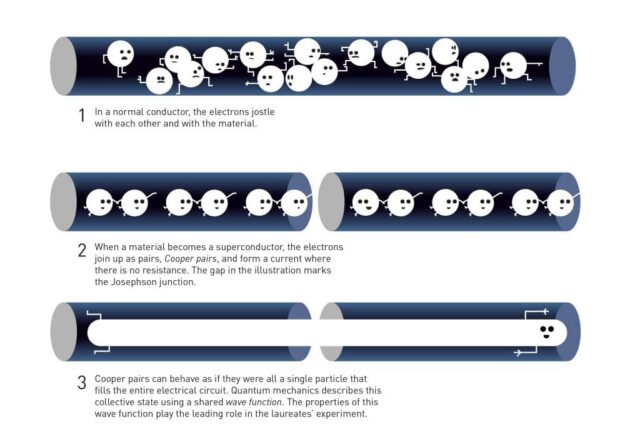
Superconductivity occurs when electrons join to form what are called Cooper pairs, overcoming their normal repulsion. And the model can tell that apart from normal conductivity in the same material.
“You ask the question ‘What’s the chance that one of the charged particles spontaneously disappears because of quantum fluctuations and goes over here?’” Dreyer said, describing what happens when simulating a conductor. “What people do in superconductivity is they take this concept, but instead of asking what’s the chance of a single-charge particle to tunnel over there spontaneously, they’re asking what is the chance of a pair to tunnel spontaneously?”
Even in its simplified form, however, it’s still a model of a quantum system, with all the computational complexity that comes with that. So the Quantinuum team modeled a few systems that classical computers struggle with. One was simply looking at a larger grid of atoms than most classical simulations have done; another expanded the grid in an additional dimension, modeling layers of a material. Perhaps the most complicated simulation involved what happens when a laser pulse of the right wavelength hits a superconductor at room temperature, an event that briefly induces a superconducting state.
And the system produced results, even without error correction. “It’s maybe a technical point, but I think it’s very important technical point, which is [that] the circuits that we ran, they all had errors,” Dreyer told Ars. “Maybe on the average of three or so errors, and for some reason, that is not very fully understood for this application, it doesn’t matter. You still get almost the perfect result in some of these cases.”
That said, he also indicated that having higher-fidelity hardware would help the team do a better job of putting the system in a ground state or running the simulation for longer. But those will have to wait for future hardware.
What’s next
If you look at Quantinuum’s roadmap for that future hardware, Helios would appear to be the last of its kind. It and earlier versions of the processors have loops and large straight stretches; everything in the future features a grid of squares. But both Strabley and Hayes said that Helios has several key transitional features. “Those ions are moving through that junction many, many times over the course of a circuit,” Strabley told Ars. “And so it’s really enabled us to work on the reliability of the junction, and that will translate into the large-scale systems.”
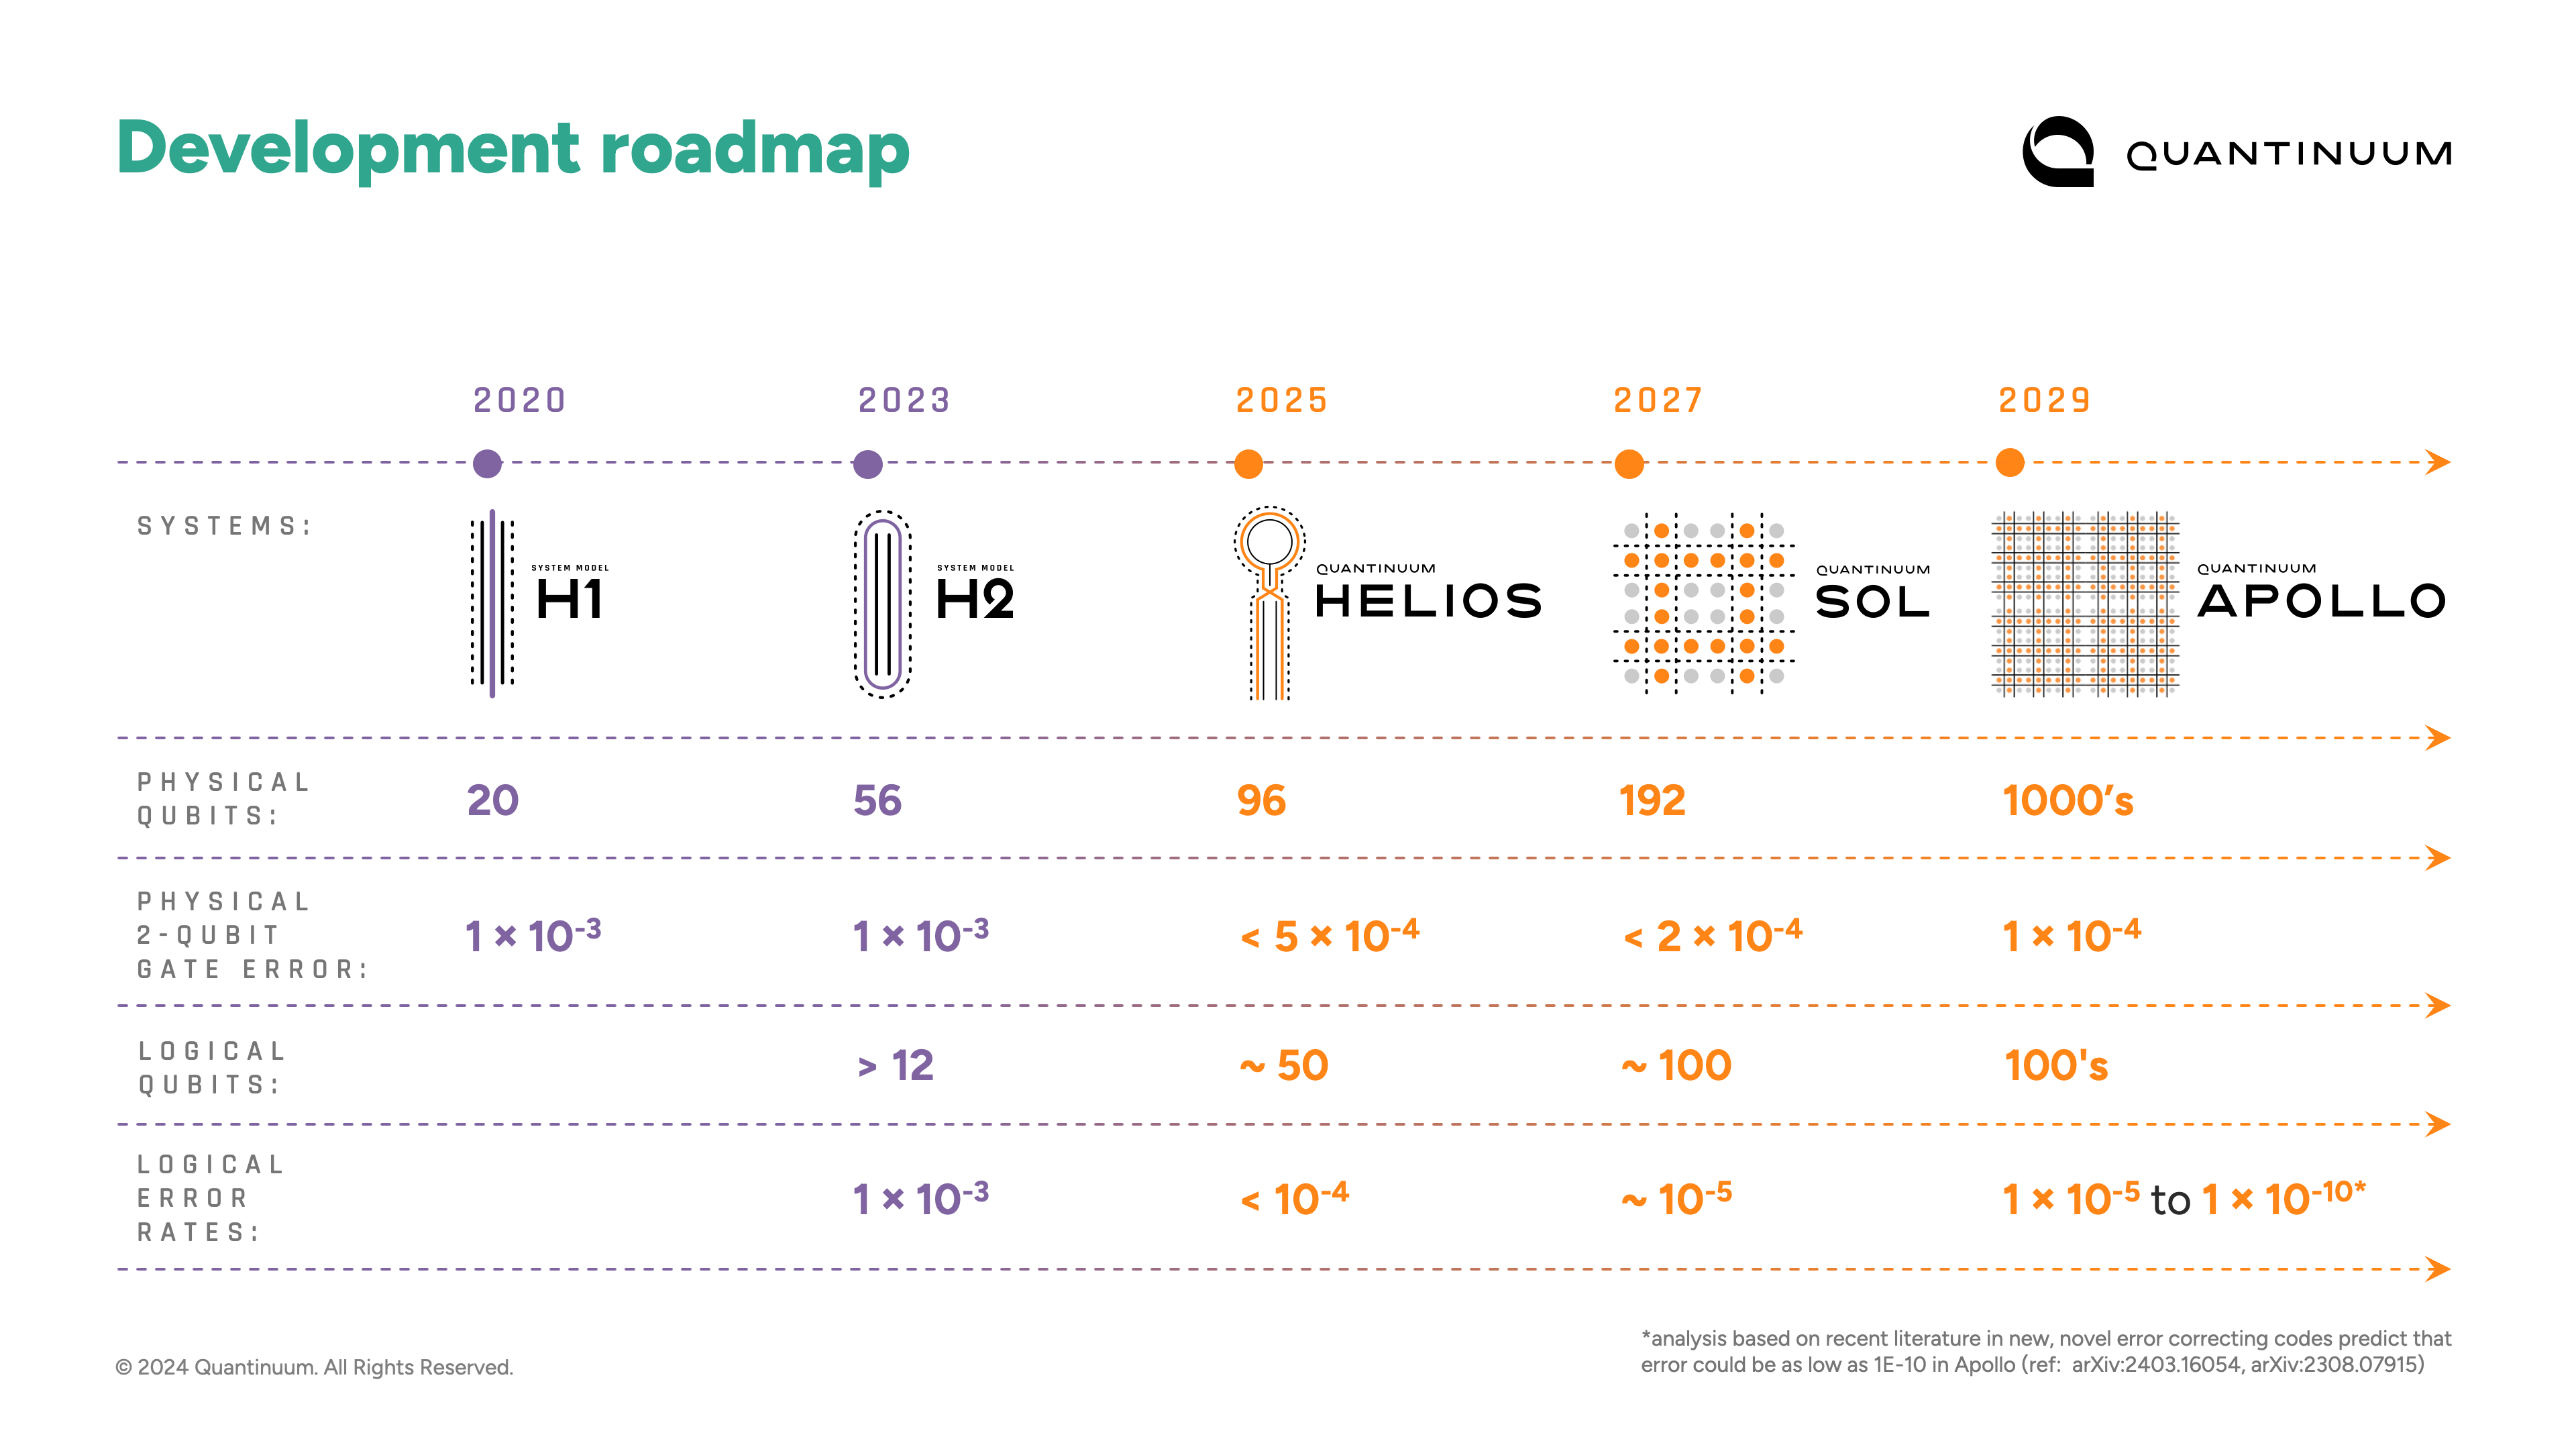
Helios sits at the pivot between the simple geometries of earlier Quantinuum processors and the grids of future designs. Credit: Quantinuum
The collection of squares seen in future processors will also allow the same sorts of operations to be done with the loop-and-legs of Helios. Some squares can serve as the equivalent of a loop in terms of storage and sorting, while some of the straight lines nearby can be used for operations.
“What will be common to both of them is kind of the general concept that you can have a storage and sorting region and then gating regions on the side and they’re separated from one another,” Hayes said. “It’s not public yet, but that’s the direction we’re heading: a storage region where you can do really fast sorting in these 2D grids, and then gating regions that have parallelizable logical operations.”
In the meantime, we’re likely to see improvements made to Helios—ideas that didn’t quite make today’s release. “There’s always one more improvement that people want to make, and I’m the person that says, ‘No, we’re going to go now. Put this on the market, and people are going to go use it,’” Strabley said. “So there is a long list of things that we’re going to add to improve the performance. So expect that over the course of Helios, the performance is going to get better and better and better.”
That performance is likely to be used for the sort of initial work done on superconductivity or the algorithm recently described by Google, which is at or a bit beyond what classical computers can manage and may start providing some useful insights. But it will still be a generation or two before we start seeing quantum computing fulfill some of its promise.

John is Ars Technica’s science editor. He has a Bachelor of Arts in Biochemistry from Columbia University, and a Ph.D. in Molecular and Cell Biology from the University of California, Berkeley. When physically separated from his keyboard, he tends to seek out a bicycle, or a scenic location for communing with his hiking boots.
New quantum hardware puts the mechanics in quantum mechanics Read More »