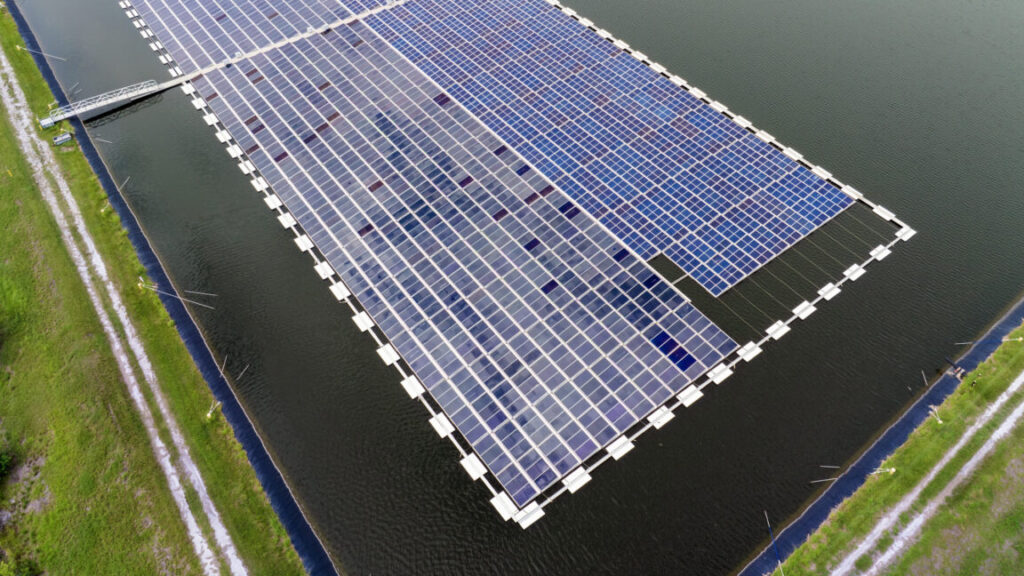
On Tuesday, the US Energy Information Administration released full-year data on how the country generated electricity in 2025. It’s a bit of a good news/bad news situation. The bad news is that overall demand rose appreciably, and a fair chunk of that was met by additional coal use. On the good side, solar continued its run of astonishing growth, generating 35 percent more power than a year earlier and surpassing hydroelectric power for the first time.
Shifting markets
Overall, electrical consumption in the US rose by 2.8 percent, or about 121 terawatt-hours. Consumption had been largely flat for several decades, with efficiency and the decline of industry offsetting the effects of population and economic growth. There were plenty of year-to-year changes, however, driven by factors ranging from heating and cooling demand to a global pandemic. Given that history, the growth in demand in 2025 is a bit concerning, but it’s not yet a clear signal that the factors that will inevitably drive growth have kicked in.
(These factors include things like the switch to heat pumps, the electrification of transportation, and the growth in data centers. While the first two of those involve a more efficient use of energy overall, they involve electricity replacing direct use of fossil fuels, and so will increase demand on the grid.)
The story of the year is how that demand was met. If demand grows more slowly, the additional 85 terawatt-hours generated by expanded utility-scale and small solar installations would have easily met it. As it was, the growth of utility-scale solar was only sufficient to cover about two-thirds of the rising demand (or 73 percent if you include wind power). With no new nuclear plants on the horizon, the alternative was to meet it with fossil fuels.
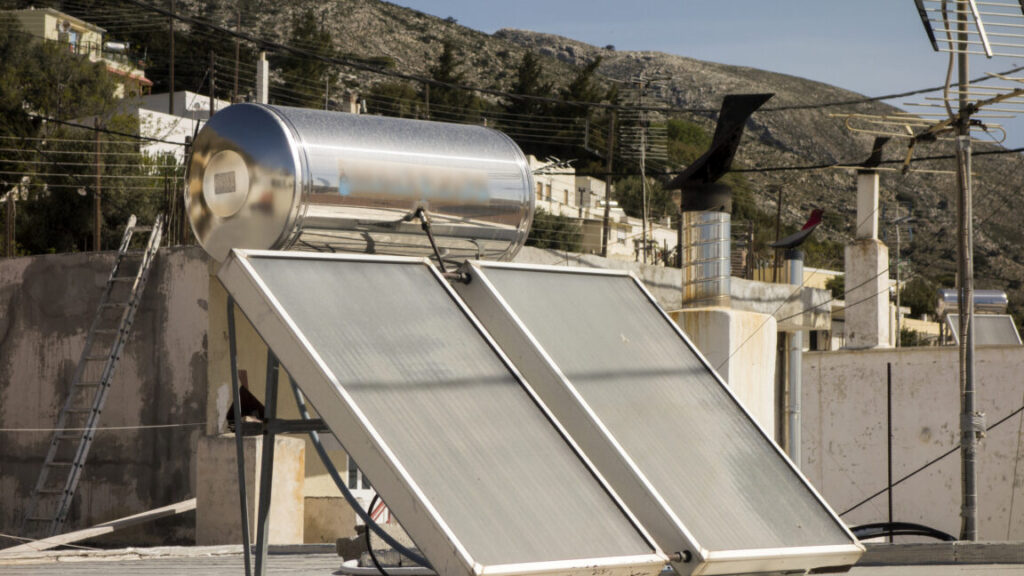
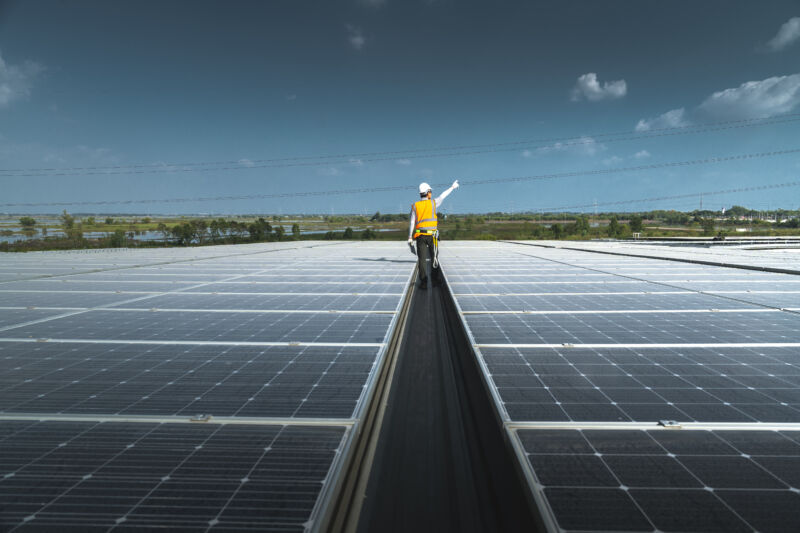
Sunlight can cause a molecule to change structure, and then release heat later.
The system works a bit like existing solar water heaters, but with chemical heat storage. Credit: Kypros
Heating accounts for nearly half of the global energy demand, and two-thirds of that is met by burning fossil fuels like natural gas, oil, and coal. Solar energy is a possible alternative, but while we have become reasonably good at storing solar electricity in lithium-ion batteries, we’re not nearly as good at storing heat.
To store heat for days, weeks, or months, you need to trap the energy in the bonds of a molecule that can later release heat on demand. The approach to this particular chemistry problem is called molecular solar thermal (MOST) energy storage. While it has been the next big thing for decades, it never really took off.
In a recent Science paper, a team of researchers from the University of California, Santa Barbara, and UCLA demonstrate a breakthrough that might finally make MOST energy storage effective.
The DNA connection
In the past, MOST energy storage solutions have been plagued by lackluster performance. The molecules either didn’t store enough energy, degraded too quickly, or required toxic solvents that made them impractical. To find a way around these issues, the team led by Han P. Nguyen, a chemist at the University of California, Santa Barbara, drew inspiration from the genetic damage caused by sunburn. The idea was to store energy using a reaction similar to the one that allows UV light to damage DNA.
When you stay out on the beach too long, high-energy ultraviolet light can cause adjacent bases in the DNA (thymine, the T in the genetic code) to link together. This forms a structure known as a (6-4) lesion. When that lesion is exposed to even more UV light, it twists into an even stranger shape called a “Dewar” isomer. In biology, this is rather bad news, as Dewar isomers cause kinks in the DNA’s double-helix spiral that disrupt copying the DNA and can lead to mutations or cancer.
To counter this effect, evolution shaped a specific enzyme called photolyase to hunt (6-4) lesions down and snap them back into their safe, stable forms.
The researchers realized that the Dewar isomer is essentially a molecular battery. This snap-back effect was exactly what Nguyen’s team was looking for, since it releases a lot of heat.
Rechargeable fuel
Molecular batteries, in principle, are extremely good at storing energy. Heating oil, arguably the most popular molecular battery we use for heating, is essentially ancient solar energy stored in chemical bonds. Its energy density stands at around 40 Megajoules per kilo. To put that in perspective, Li-ion batteries usually pack less than one MJ/kg. One of the problems with heating oil, though, is that it is single-use only—it gets burnt when you use it. What Nguyen and her colleagues aimed to achieve with their DNA-inspired substance is essentially a reusable fuel.
To do that, researchers synthesized a derivative of 2-pyrimidone, a chemical cousin of the thymine found in DNA. They engineered this molecule to reliably fold into a Dewar isomer under sunlight and then unfold on command. The result was a rechargeable fuel that could absorb the energy when exposed to sunlight, release it when needed, and return to a “relaxed” state where it’s ready to be charged up again.
Previous attempts at MOST systems have struggled to compete with Li-ion batteries. Norbornadiene, one of the best-studied candidates, tops out at around 0.97 MJ/kg. Another contender, azaborinine, manages only 0.65 MJ/kg. They may be scientifically interesting, but they are not going to heat your house.
Nguyen’s pyrimidone-based system blew those numbers out of the water. The researchers achieved an energy storage density of 1.65 MJ/kg—nearly double the capacity of Li-ion batteries and substantially higher than any previous MOST material.
Double rings
The reason for this jump in performance was what the team called compounded strain.
When the pyrimidone molecule absorbs light, it doesn’t just fold; it twists into a fused, bicyclic structure containing two different four-membered rings: 1,2-dihydroazete and diazetidine. Four-membered rings are under immense structural tension. By fusing them together, the researchers created a molecule that is desperate to snap back into its relaxed state.
Achieving high energy density on paper is one thing. Making it work in the real world is another. A major failing of previous MOST systems is that they are solids that need to be dissolved in solvents like toluene or acetonitrile to work. Solvents are the enemy of energy density—by diluting your fuel to 10 percent concentration, for example, you effectively cut your energy density by 90 percent. Any solvent used means less fuel.
Nguyen’s team tackled this by designing a version of their molecule that is a liquid at room temperature, so it doesn’t need a solvent. This simplified operations considerably, as the liquid fuel could be pumped through a solar collector to charge it up and store it in a tank.
Unlike many organic molecules that hate water, Nguyen’s system is compatible with aqueous environments. This means if a pipe leaks, you aren’t spewing toxic fluids like toluene around your house. The researchers even demonstrated that the molecule could work in water and that its energy release was intense enough to boil it.
The MOST-based heating system, the team says in their paper, would circulate this rechargeable fuel through panels on the roof to capture the sun’s light and then store it in the basement tank. The fuel from this tank would later be pumped to a reaction chamber with an acid catalyst that triggers the energy release. Then, through a heat exchanger, this energy would heat up the water in the standard central heating system.
But there’s a catch.
Looking for the leak
The first hurdle is the spectrum of light that puts energy in the Nguyen’s fuel. The Sun bathes us in a broad spectrum of light, from infrared to ultraviolet. Ideally, a solar collector should use as much of this as possible, but the pyrimidone molecules only absorb light in the UV-A and UV-B range, around 300-310 nm. That represents about five percent of the total solar spectrum. The vast majority of the Sun’s energy, the visible light and the infrared, passes right through Nguyen’s molecules without charging them.
The second problem is quantum yield. This is a fancy way of asking, “For every 100 photons that hit the molecule, how many actually make it switch to the Dewar isomer state?” For these pyrimidones, the answer is a rather underwhelming number, in the single digits. Low quantum yield means the fluid needs a longer exposure to sunlight to get a full charge.
The researchers hypothesize that the molecule has a fast leak, meaning a non-radiative decay path where the excited molecule shakes off the energy as heat immediately instead of twisting into the storage form. Plugging that leak is the next big challenge for the team.
Finally, the team in their experiments used an acid catalyst that was mixed directly into the storage material. The team admits that in a future closed-loop device, this would require a neutralization step—a reaction that eliminates the acidity after the heat is released. Unless the reaction products can be purified away, this will reduce the energy density of the system.
Still, despite the efficiency issues, the stability of the Nguyen’s system looks promising.
The MOST storage?
One of the biggest fears with chemical storage is thermal reversion—the fuel spontaneously discharges because it got a little too warm in the storage tank. But the Dewar isomers of the pyrimidones are incredibly stable. The researchers calculated a half-life of up to 481 days at room temperature for some derivatives. This means the fuel could be charged in the heat of July, and it would remain fully charged when you need to heat your home in January. The degradation figures also look decent for a MOST energy storage. The team ran the system through 20 charge-discharge cycles with negligible decay.
The problem with separating the acid from the fuel could be solved in a practical system by switching to a different catalyst. The scientists suggest in the paper that in this hypothetical setup, the fuel would flow through an acid-functionalized solid surface to release heat, thus eliminating the need for neutralization afterwards.
Still, we’re rather far away using MOST systems for heating actual homes. To get there, we’re going to need molecules that absorb far more of the light spectrum and convert to the activated state with a higher efficiency. We’re just not there yet.
Jacek Krywko is a freelance science and technology writer who covers space exploration, artificial intelligence research, computer science, and all sorts of engineering wizardry.
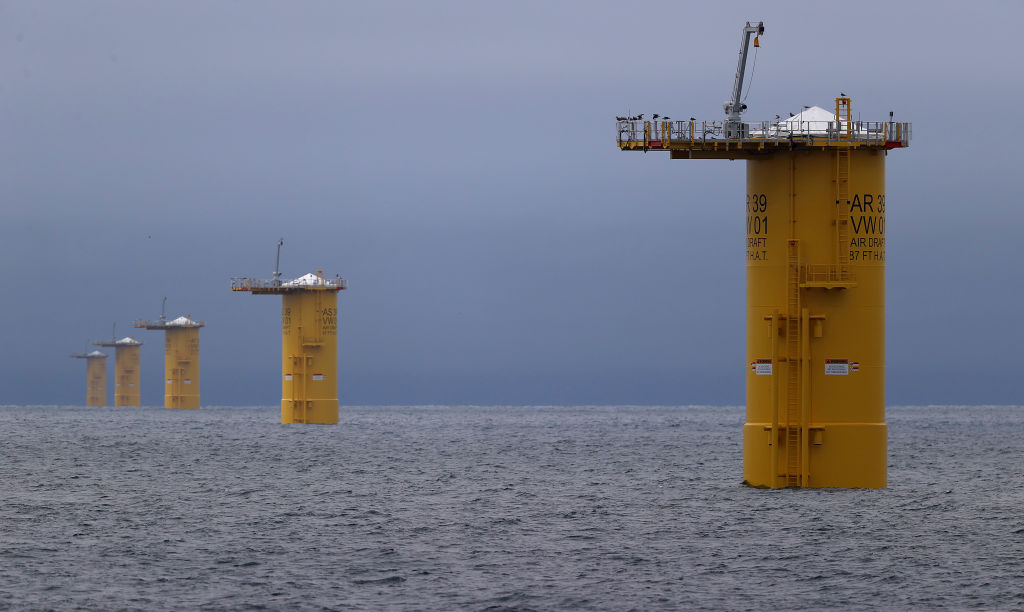
Based on reporting elsewhere, some of the judges viewed the classified report that was used to justify the order to halt construction, but they didn’t find it persuasive. In one case, the judge noted that the government wasn’t acting as if the security risks were real. The threat supposedly comes from the operation of the wind turbines, but the Department of the Interior’s order blocked construction while allowing any completed hardware to operate.
“If the government’s concern is the operation of these facilities, allowing the ongoing operation of the 44 turbines while prohibiting the repair of the existing turbines and the completion of the 18 additional turbines is irrational,” Judge Brian E. Murphy said. That once again raises the possibility that the order halting construction will ultimately be held to be arbitrary and capricious.
For now, however, the courts are largely offering the wind projects relief because the ruling was issued without any warning or communication from the government and would clearly inflict substantial harm on the companies building them. The injunction blocks the government’s hold on construction until a final ruling is issued. The government can still appeal the decision before that point, but the consistency among these rulings suggests it will likely fail.
Several of these projects are near completion and are likely to be done before any government appeal can be heard.
On Monday, the US Department of the Interior announced that it was pausing the leases on all five offshore wind sites currently under construction in the US. The move comes despite the fact that these projects already have installed significant hardware in the water and on land; one of them is nearly complete. In what appears to be an attempt to avoid legal scrutiny, the Interior is blaming the decisions on a classified report from the Department of Defense.
The second Trump administration announced its animosity toward offshore wind power literally on day one, issuing an executive order on inauguration day that called for a temporary halt to issuing permits for new projects pending a re-evaluation. Earlier this month, however, a judge vacated that executive order, noting that the government has shown no indication that it was even attempting to start the re-evaluation it said was needed.
But a number of projects have gone through the entire permitting process, and construction has started. Before today, the administration had attempted to stop these in an erratic, halting manner. Empire Wind, an 800 MW farm being built off New York, was stopped by the Department of the Interior, which alleged that it had been rushed through permitting. That hold was lifted following lobbying and negotiations by New York and the project developer Orsted, and the Department of the Interior never revealed why it changed its mind. When the Interior Department blocked a second Orsted project, Revolution Wind offshore of southern New England, the company took the government to court and won a ruling that let it continue construction.
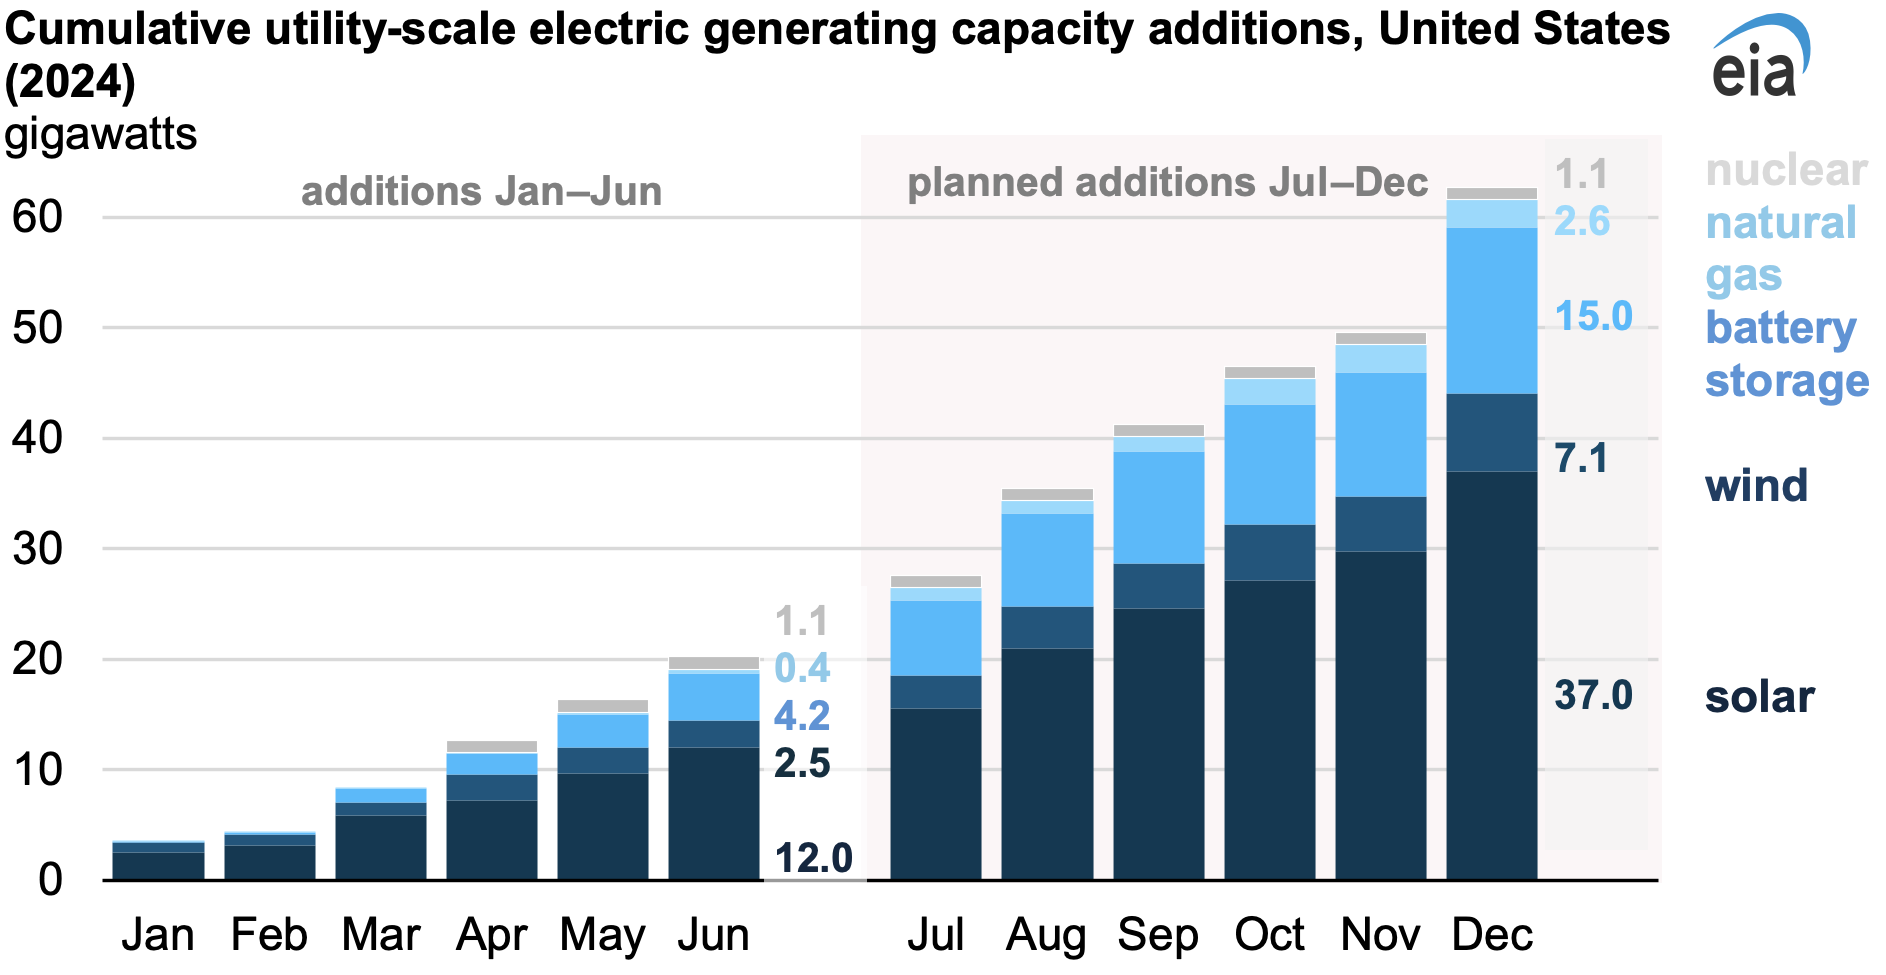
While solar power is growing at an extremely rapid clip, in absolute terms, the use of natural gas for electricity production has continued to outpace renewables. But that looks set to change in 2024, as the US Energy Information Agency (EIA) has run the numbers on the first half of the year and found that wind, solar, and batteries were each installed at a pace that dwarfs new natural gas generators. And the gap is expected to get dramatically larger before the year is over.
Solar, batteries booming
According to the EIA’s numbers, about 20 GW of new capacity was added in the first half of this year, and solar accounts for 60 percent of it. Over a third of the solar additions occurred in just two states, Texas and Florida. There were two projects that went live that were rated at over 600 MW of capacity, one in Texas, the other in Nevada.
Next up is batteries: The US saw 4.2 additional gigawatts of battery capacity during this period, meaning over 20 percent of the total new capacity. (Batteries are treated as the equivalent of a generating source by the EIA since they can dispatch electricity to the grid on demand, even if they can’t do so continuously.) Texas and California alone accounted for over 60 percent of these additions; throw in Arizona and Nevada, and you’re at 93 percent of the installed capacity.
The clear pattern here is that batteries are going where the solar is, allowing the power generated during the peak of the day to be used to meet demand after the sun sets. This will help existing solar plants avoid curtailing power production during the lower-demand periods in the spring and fall. In turn, this will improve the economic case for installing additional solar in states where its production can already regularly exceed demand.
Wind power, by contrast, is running at a more sedate pace, with only 2.5 GW of new capacity during the first six months of 2024. And for likely the last time this decade, additional nuclear power was placed on the grid, at the fourth 1.1 GW reactor (and second recent build) at the Vogtle site in Georgia. The only other additions came from natural gas-powered facilities, but these totaled just 400 MW, or just 2 percent of the total of new capacity.
Enlarge/ Wind, solar, and batteries are the key contributors to new capacity in 2024.
The EIA has also projected capacity additions out to the end of 2024 based on what’s in the works, and the overall shape of things doesn’t change much. However, the pace of installation goes up as developers rush to get their project operational within the current tax year. The EIA expects a bit over 60 GW of new capacity to be installed by the end of the year, with 37 GW of that coming in the form of solar power. Battery growth continues at a torrid pace, with 15 GW expected, or roughly a quarter of the total capacity additions for the year.
Wind will account for 7.1 GW of new capacity, and natural gas 2.6 GW. Throw in the contribution from nuclear, and 96 percent of the capacity additions of 2024 are expected to operate without any carbon emissions. Even if you choose to ignore the battery additions, the fraction of carbon-emitting capacity added remains extremely small, at only 6 percent.
Gradual shifts on the grid
Obviously, these numbers represent the peak production of these sources. Over a year, solar produces at about 25 percent of its rated capacity in the US, and wind at about 35 percent. The former number will likely decrease over time as solar becomes inexpensive enough to make economic sense in places that don’t receive as much sunshine. By contrast, wind’s capacity factor may increase as more offshore wind farms get completed. For natural gas, many of the newer plants are being designed to operate erratically so that they can provide power when renewables are under-producing.
A clearer sense of what’s happening comes from looking at the generating sources that are being retired. The US saw 5.1 GW of capacity drop off the grid in the first half of 2024, and aside from a 0.2 GW of “other,” all of it was fossil fuel-powered, including 2.1 GW of coal capacity and 2.7 GW of natural gas. The latter includes a large 1.4 GW natural gas plant in Massachusetts.
But total retirements are expected to be just 7.5 GWO this year—less than was retired in the first half of 2023. That’s likely because the US saw electricity use rise by 5 percent in the first half of 2025, based on numbers the EIA released on Friday (note that this link will take you to more recent data a month from now). It’s unclear how much of that was due to weather—a lot of the country saw heat that likely boosted demand for air conditioning—and how much could be accounted for by rising use in data centers and for the electrification of transit and appliances.
That data release includes details on where the US got its electricity during the first half of 2024. The changes aren’t dramatic compared to where they were when we looked at things last month. Still, what has changed over the past month is good news for renewables. In May, wind and solar production were up 8.4 percent compared to the same period the year before. By June, they were up by over 12 percent.
Given the EIA’s expectations for the rest of the year, the key question is likely to be whether the pace of new solar installations is going to be enough to offset the drop in production that will occur as the US shifts to the winter months.
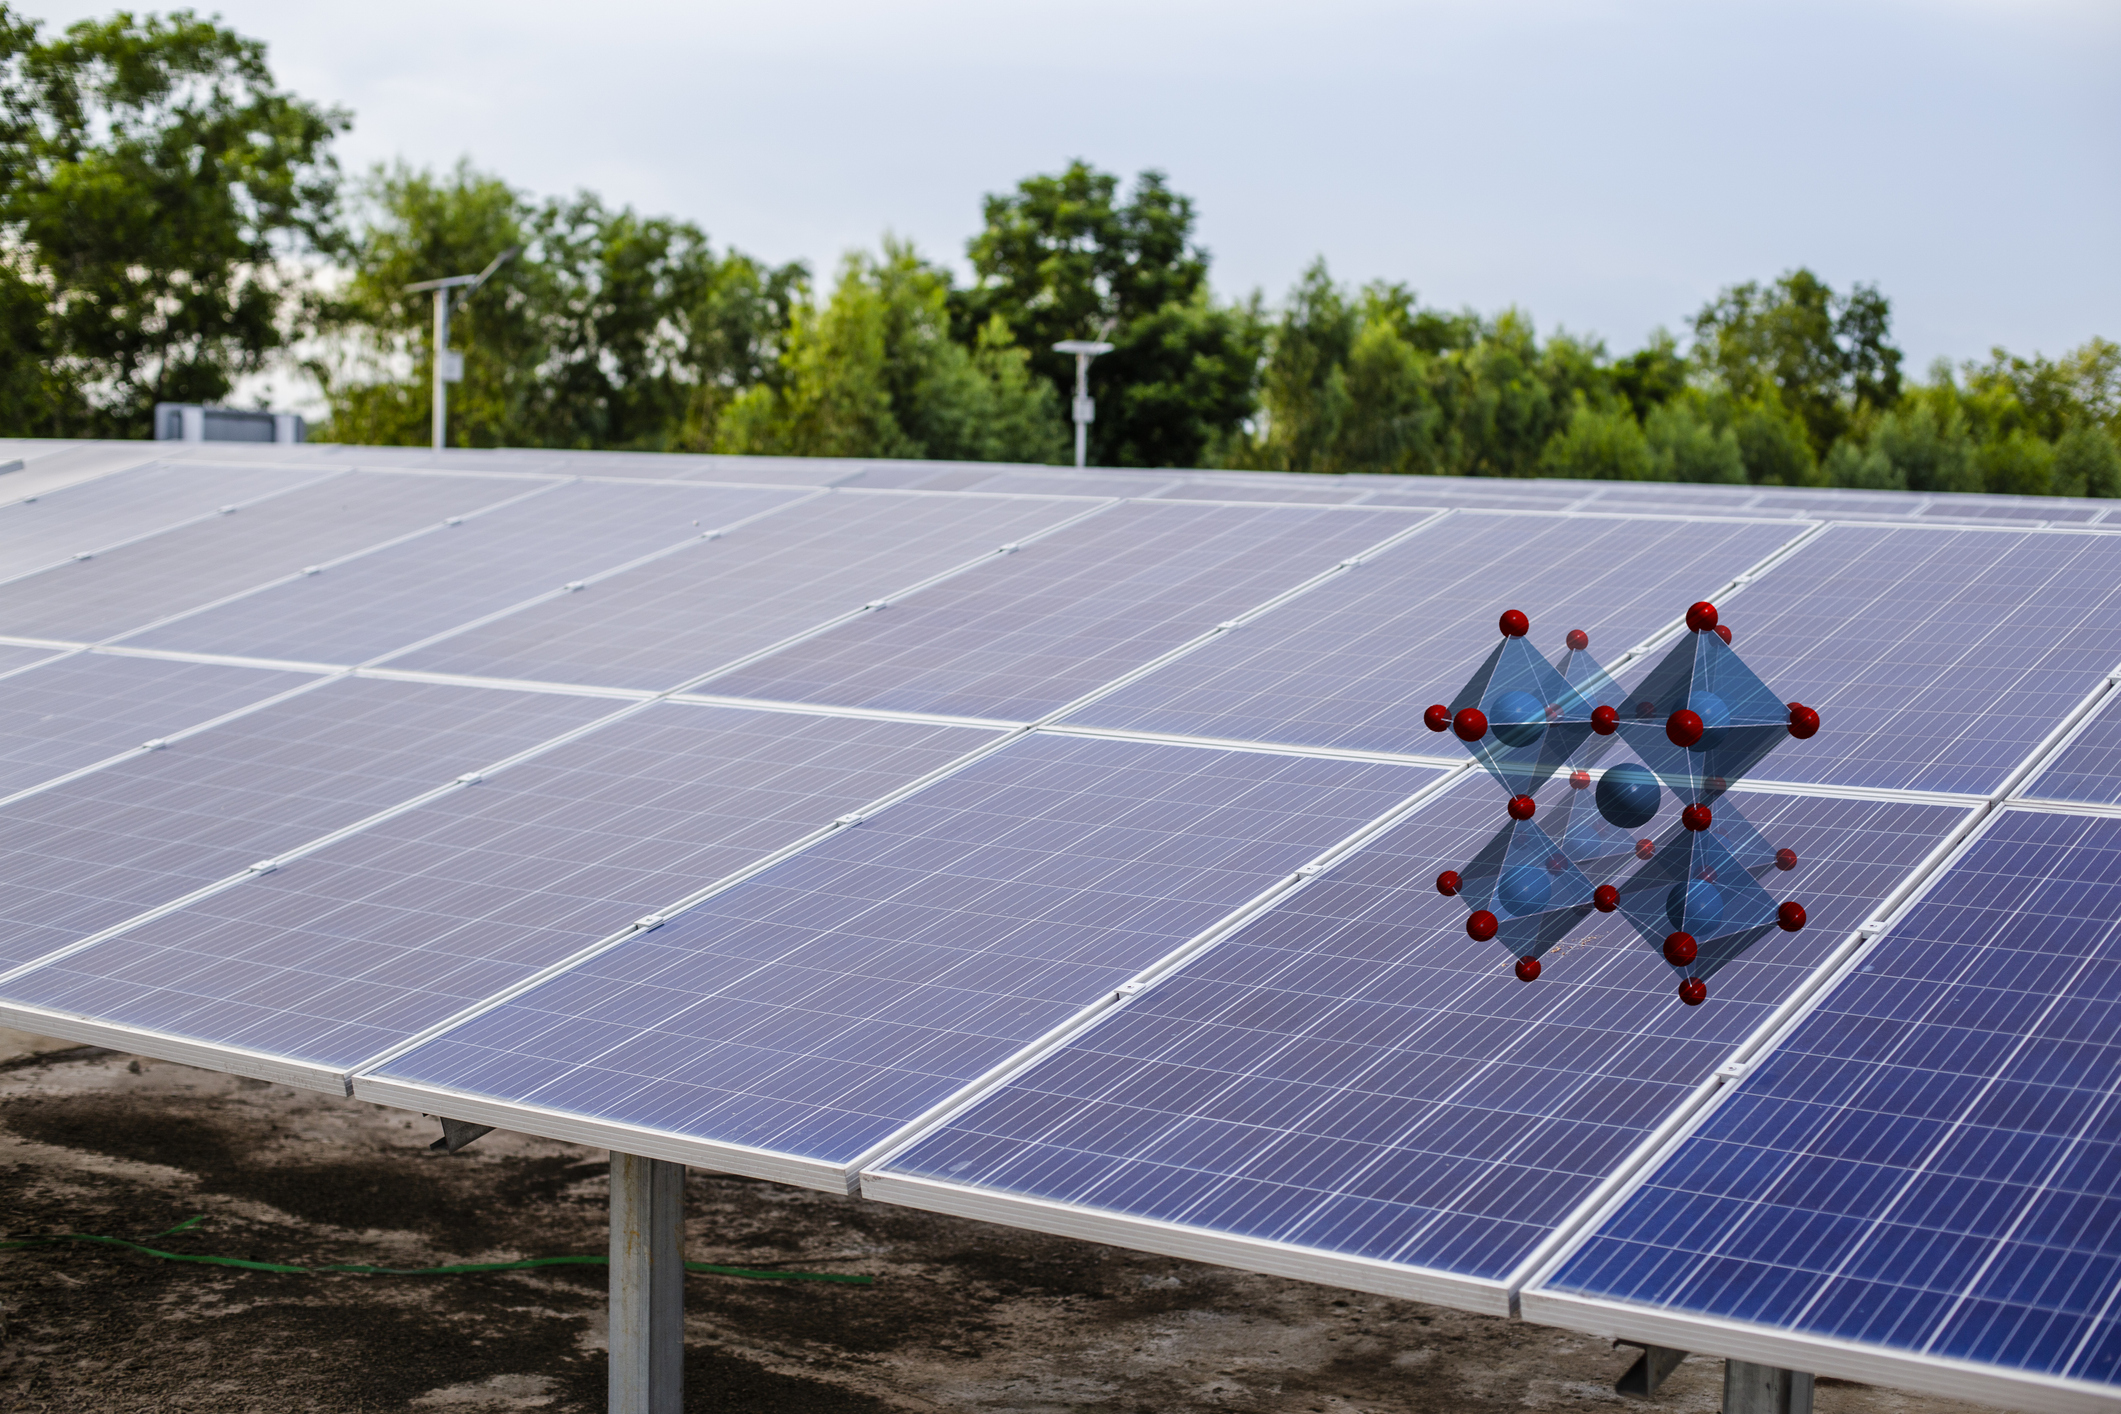
Enlarge/ Some solar panels, along with a diagram of a perovskite’s crystal structure.
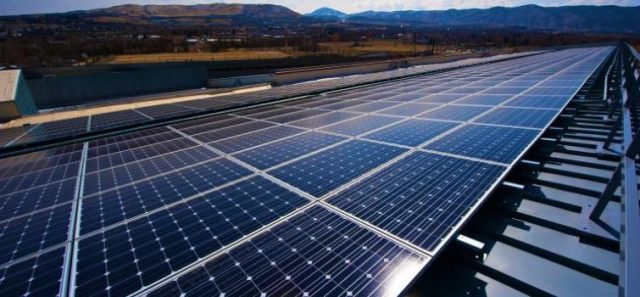
As the price of silicon panels has continued to come down, we’ve reached the point where they’re a small and shrinking cost of building a solar farm. That means that it might be worth spending more to get a panel that converts more of the incoming sunlight to electricity, since it allows you to get more out of the price paid to get each panel installed. But silicon panels are already pushing up against physical limits on efficiency. Which means our best chance for a major boost in panel efficiency may be to combine silicon with an additional photovoltaic material.
Right now, most of the focus is on pairing silicon with a class of materials called perovskites. Perovskite crystals can be layered on top of silicon, creating a panel with two materials that absorb different areas of the spectrum—plus, perovskites can be made from relatively cheap raw materials. Unfortunately, it has been difficult to make perovskites that are both high-efficiency and last for the decades that the silicon portion will.
Lots of labs are attempting to change that, though. And two of them reported some progress this week, including a perovskite/silicon system that achieved 34 percent efficiency.
Boosting perovskite stability
Perovskites are an entire class of materials that all form the same crystal structure. So, there is plenty of flexibility when it comes to the raw materials being used. Perovskite-based photovoltaics are typically formed by what’s called solution processing, in which all the raw materials are dissolved in a liquid that’s then layered on top of the panel-to-be, allowing perovskite crystals to form across its entire surface. Which is great, except that this process tends to form multiple crystals with different orientations on a single surface, decreasing performance.
Adding to the problems, perovskites are also not especially stable. They’re usually made of a combination of positively and negatively charged ions, and these have to be present in the right ratios to form a perovskite. However, some of these individual ions can diffuse over time, disrupting the crystal structure. Harvesting solar energy, which involves the material absorbing lots of energy, makes matters worse by heating the material, which increases the rate of diffusion.
Combined, these factors sap the efficiency of perovskite solar cells and mean that none lasts nearly as long as a sheet of silicon. The new works tackle these issues from two very different directions.
The first of the new papers tackles stability by using the flexibility of perovskites to incorporate various ions. The researchers started by using a technique called density functional theory to model how different molecules would behave when placed into a spot normally occupied by a positively charged ion. And the modeling got them excited about a molecule called tetrahydrotriazinium, which has a six-atom ring composed of alternating carbon and nitrogen atoms. The regular placement of nitrogens around the ring allows it to form regular interactions with neighboring atoms in the crystal structure.
Tetrahydrotriazinium has a neutral charge when only two of the nitrogens have hydrogens attached to them. But it typically grabs a charged hydrogen (effectively, a proton) out of solution, giving it a net positive charge. This leaves each of its three nitrogens associated with a hydrogen and allows the positive charge to be distributed among them. That makes this interaction incredibly strong, meaning that the hydrogens are extremely unlikely to drift off, which also stabilizes the crystal structure.
So, this should make perovskites much, much more stable. The only problem? Tetrahydrotriazinium tends to react with lots of other chemicals, so it’s difficult to provide as a raw material for the perovskite-forming solution.
Enlarge/ Some of the waste material that ends up part of these bricks.
Seamus Daniel, RMIT University
Researchers at the Royal Melbourne Institute of Technology (RMIT) in Australia have developed special “energy-smart bricks” that can be made by mixing clay with glass waste and coal ash. These bricks can help mitigate the negative effects of traditional brick manufacturing, an energy-intensive process that requires large-scale clay mining, contributes heavily to CO2 emissions, and generates a lot of air pollution.
According to the RMIT researchers, “Brick kilns worldwide consume 375 million tonnes (~340 million metric tons) of coal in combustion annually, which is equivalent to 675 million tonnes of CO2 emission (~612 million metric tons).” This exceeds the combined annual carbon dioxide emissions of 130 million passenger vehicles in the US.
The energy-smart bricks rely on a material called RCF waste. It mostly contains fine pieces of glass (92 percent) left over from the recycling process, along with ceramic materials, plastic, paper, and ash. Most of this waste material generally ends up in landfills, where it can cause soil and water degradation. However, the study authors note, “The utilization of RCF waste in fired-clay bricks offers a potential solution to the increasing global waste crisis and reduces the burden on landfills.”
What makes the bricks “energy-smart”
Compared to traditional bricks, the newly developed energy-smart bricks have lower thermal conductivity: They retain heat longer and undergo more uniform heating. This means they can be manufactured at lower firing temperatures. For instance, while regular clay bricks are fired (a process during which bricks are baked in a kiln, so they become hard and durable) at 1,050° C, energy-smart bricks can achieve the required hardness at 950° C, saving 20 percent of the energy needed for traditional brickmaking.
Based on bricks produced in their lab, they estimated that “each firing cycle led to a potential value of up to $158,460 through a reduction of 417 tonnes of CO2, resulting from a 9.5 percent reduction in firing temperature.” So basically, if a manufacturer switches from regular clay bricks to energy-smart bricks, it will end up saving thousands of dollars on its power bill, and its kilns will release less CO2 into Earth’s atmosphere. Scaled up to the estimated 1.4 trillion bricks made each year, the savings are substantial.
But brick manufacturers aren’t the only ones who benefit. “Bricks characterized by low thermal conductivity contribute to efficient heat storage and absorption, creating a cooler environment during summer and a warmer comfort during winter. This advantage translates into energy savings for air conditioning, benefiting the occupants of the house or building,” the study authors explained.
Tests conducted by the researchers suggest that the residents of a single-story house built using energy-smart bricks will save up to 5 percent on their energy bills compared to those living in a house made with regular clay bricks.
California’s electric grid, with its massive solar production and booming battery installations, is already on the cutting edge of the US’s energy transition. And it’s likely to stay there, as the state will require that all passenger vehicles be electric by 2035. Obviously, that will require a grid that’s able to send a lot more electrons down its wiring and a likely shift in the time of day that demand peaks.
Is the grid ready? And if not, how much will it cost to get it there? Two researchers at the University of California, Davis—Yanning Li and Alan Jenn—have determined that nearly two-thirds of its feeder lines don’t have the capacity that will likely be needed for car charging. Updating to handle the rising demand might set its utilities back as much as 40 percent of the existing grid’s capital cost.
The lithium state
Li and Jenn aren’t the first to look at how well existing grids can handle growing electric vehicle sales; other research has found various ways that different grids fall short. However, they have access to uniquely detailed data relevant to California’s ability to distribute electricity (they do not concern themselves with generation). They have information on every substation, feeder line, and transformer that delivers electrons to customers of the state’s three largest utilities, which collectively cover nearly 90 percent of the state’s population. In total, they know the capacity that can be delivered through over 1,600 substations and 5,000 feeders.
California has clear goals for its electric vehicles, and those are matched with usage based on the California statewide travel demand model, which accounts for both trips and the purpose of those trips. These are used to determine how much charging will need to be done, as well as where that charging will take place (home or a charging station). Details on that charging comes from the utilities, charging station providers, and data logs.
They also project which households will purchase EVs based on socioeconomic factors, scaled so that adoption matches the state’s goals.
Combined, all of this means that Li and Jenn can estimate where charging is taking place and how much electricity will be needed per charge. They can then compare that need to what the existing grid has the capacity to deliver.
It falls short, and things get worse very quickly. By 2025, only about 7 percent of the feeders will experience periods of overload. By 2030, that figure will grow to 27 percent, and by 2035—only about a decade away—about half of the feeders will be overloaded. Problems grow a bit more slowly after that, with two-thirds of the feeders overloaded by 2045, a decade after all cars sold in California will be EVs. At that point, total electrical demand will be close to twice the existing capacity.
Almost from the start, arguments about mitigating climate change have included an element of cost-benefit analysis: Would it cost more to move the world off fossil fuels than it would to simply try to adapt to a changing world? A strong consensus has built that the answer to the question is a clear no, capped off by a Nobel in Economics given to one of the people whose work was key to building that consensus.
While most academics may have considered the argument put to rest, it has enjoyed an extended life in the political sphere. Large unknowns remain about both the costs and benefits, which depend in part on the remaining uncertainties in climate science and in part on the assumptions baked into economic models.
In Wednesday’s edition of Nature, a small team of researchers analyzed how local economies have responded to the last 40 years of warming and projected those effects forward to 2050. They find that we’re already committed to warming that will see the growth of the global economy undercut by 20 percent. That places the cost of even a limited period of climate change at roughly six times the estimated price of putting the world on a path to limit the warming to 2° C.
Linking economics and climate
Many economic studies of climate change involve assumptions about the value of spending today to avoid the costs of a warmer climate in the future, as well as the details of those costs. But the people behind the new work, Maximilian Kotz, Anders Levermann, and Leonie Wenz decided to take an empirical approach. They obtained data about the economic performance of over 1,600 individual regions around the globe, going back 40 years. They then attempted to look for connections between that performance and climate events.
Previous research already identified a number of climate measures—average temperatures, daily temperature variability, total annual precipitation, the annual number of wet days, and extreme daily rainfall—that have all been linked to economic impacts. Some of these effects, like extreme rainfall, are likely to have immediate effects. Others on this list, like temperature variability, are likely to have a gradual impact that is only felt over time.
The researchers tested each factor for lagging effects, meaning an economic impact sometime after their onset. These suggested that temperature factors could have a lagging impact up to eight years after they changed, while precipitation changes were typically felt within four years of climate-driven changes. While this relationship might be in error for some of the economic changes in some regions, the inclusion of so many regions and a long time period should help limit the impact of those spurious correlations.
With the climate/economic relationship worked out, the researchers obtained climate projections from the Coupled Model Intercomparison Project (CMIP) project. With that in hand, they could look at future climates and estimate their economic costs.
Obviously, there are limits to how far into the future this process will work. The uncertainties of the climate models grow with time; the future economy starts looking a lot less like the present, and things like temperature extremes start to reach levels where past economic behavior no longer applies.
To deal with that, Kotz, Levermann, and Wenz performed a random sampling to determine the uncertainty in the system they developed. They look for the point where the uncertainties from the two most extreme emissions scenarios overlap. That occurs in 2049; after that, we can’t expect the past economic impacts of climate to apply.
Kotz, Levermann, and Wenz suggest that this is an indication of warming we’re already committed to, in part because the effect of past emissions hasn’t been felt in its entirety and partly because the global economy is a boat that turns slowly, so it will take time to implement significant changes in emissions. “Such a focus on the near term limits the large uncertainties about diverging future emission trajectories, the resulting long-term climate response and the validity of applying historically observed climate–economic relations over long timescales during which socio-technical conditions may change considerably,” they argue.
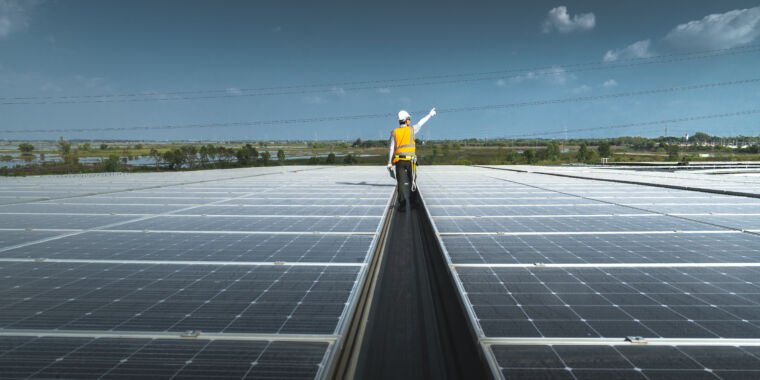
Enlarge/ NREL has taken some of the hassle out of getting permits for projects like these.
Can government agencies develop software to help cut bureaucratic red tape through automation? The answer is “yes,” according to the promising results achieved by the National Renewable Energy Laboratory (NREL), which has saved thousands of hours of labor for local governments by creating a tool called SolarAPP+ (Solar Automated Permit Processing Plus) for residential solar permits.
“We estimate that automatic SolarAPP+ permitting saved around 9,900 hours of… staff time in 2022,” NREL staff wrote in the report, “SolarAPP+ Performance Review (2022 Data). “Based on median timelines, a typical SolarAPP+ project is permitted and inspected 13 business days sooner than traditional projects… SolarAPP+ has eliminated over 134,000 days in permitting-related delays.”
SolarAPP+ automates over 100 compliance checks in the permitting process that are usually the responsibility of city, county, or town employees, according to Jeff Cook, SolarAPP+ program lead at NREL and first author of the report. It can be more accurate, thorough, and efficient than a time-pressured local government employee would be.
Saving time and money
Sometimes, the cost of permitting can be higher than the cost of solar hardware, Cook said. It depends on the specifics of the project.
“We knew that residential rooftop solar volume was increasing across the country,” Cook said. “It took us… 20 years to get to a million PV installations. And I think we got to 2 million PV installations just a few years later. And so there’s a lot of solar volume out there. And the problem is that each one of those systems needs to be reviewed for code compliance. And so if you need a human to review that, you’ve got a million applications.”
“When regulations make it unnecessarily difficult for people to quickly install solar and storage systems, it hurts everyone,” said Senator Scott Wiener (D-Calif.) in a press statement. “It hurts those who want to install solar. And it hurts communities across California, which are being negatively impacted by climate change. We need to make it easier for people to use renewable energy—that’s just a no-brainer. Expediting solar permitting is something we can do to make this a reality.”
A coalition of stakeholders from the solar industry, the US Department of Energy, and the building code-development community requested that NREL develop the software, Cook said. The organizations represented included UL Solutions and the Interstate Renewable Energy Council. (UL Solutions is a company that addresses a broad range of safety issues; initially, it focused on fire and electrical safety.)
“What we identified is the community need for the software and we identified that there was a gap in the private sector,” Cook said. “There was no incentive to do it from any active members of the private sector, but a real potential opportunity or value to the public good if such a software existed and was publicly available and free for a local government to adopt.”
Cook estimates that hundreds of thousands of hours in plan review time would have been required to manually approve all of the residential solar permits in the United States in recent years. Approving a permit for a residential solar project can take local government staff 15 minutes to an hour, and around 30 percent of the applications are later revised.
A flood of applications
“It just inundates the staff with work that they have to do,” Cook said.
“We are seeing about 750 residential requests over the past 12 months, which is about double the number of applications we saw two years ago,” said Kate Gallego, mayor of Phoenix, at the SolarAPP+ Industry Roundtable. “When I ask people in industry what we can do to speed up deployment of solar, they ask, ‘Can you do permitting faster?’ We’re at about 30 days now. We want to get that permitted as fast as possible, but we don’t want to sacrifice safety, and we want to make sure we’re not just doing it quickly, but well. That’s why this partnership was very attractive to me.”
Up to five separate departments may review the permits—the ones that oversee structural, electrical, fire, planning, and zoning decisions, Cook said.
“There’s usually a queue,” Cook said. “Just because it takes the jurisdiction only 15 minutes to review doesn’t mean that you send it to them today—they review it an hour later and get back to you. The average is, across the country, a seven-day turnaround, but it can be 30 days plus. It really varies across the country depending on how much volume of solar is in that space.”


