global warming

everyone-agrees:-2024-the-hottest-year-since-the-thermometer-was-invented

Everyone agrees: 2024 the hottest year since the thermometer was invented


An exceptionally hot outlier, 2024 means the streak of hottest years goes to 11.

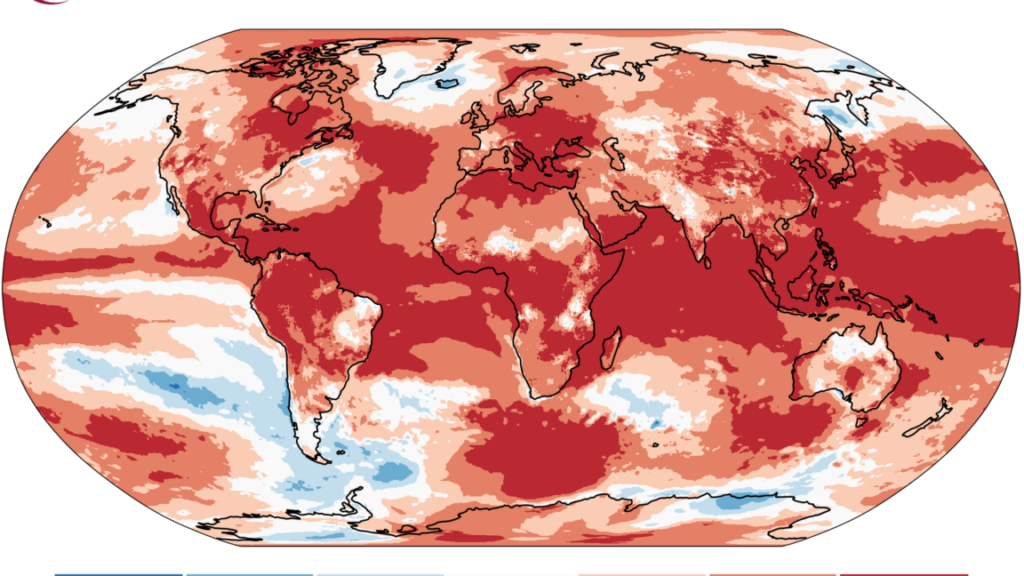
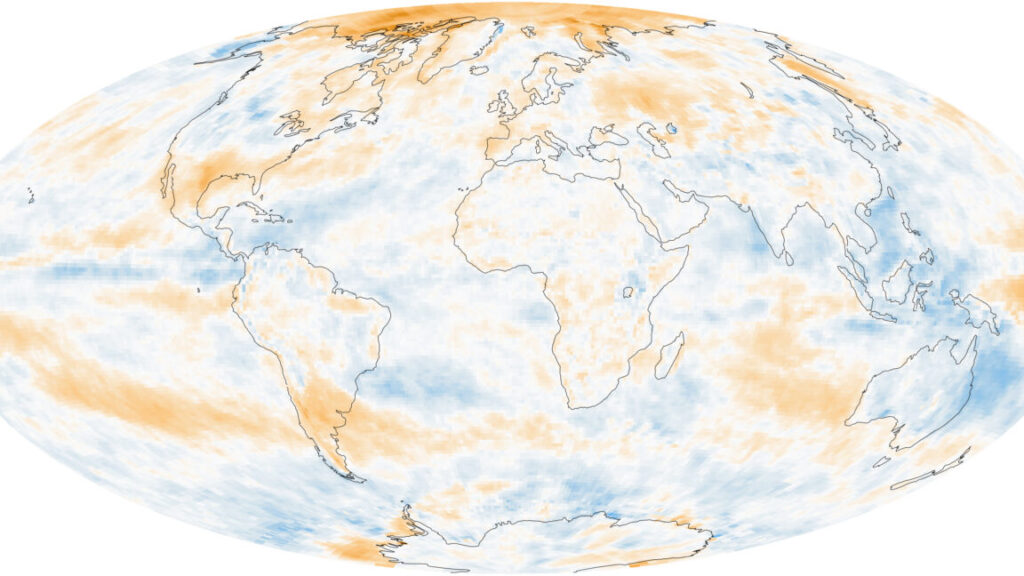
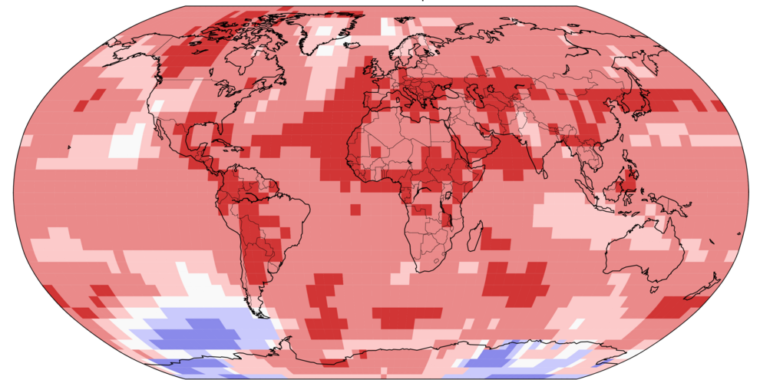
With very few and very small exceptions, 2024 was unusually hot across the globe. Credit: Copernicus

Over the last 24 hours or so, the major organizations that keep track of global temperatures have released figures for 2024, and all of them agree: 2024 was the warmest year yet recorded, joining 2023 as an unusual outlier in terms of how rapidly things heated up. At least two of the organizations, the European Union’s Copernicus and Berkeley Earth, place the year at about 1.6° C above pre-industrial temperatures, marking the first time that the Paris Agreement goal of limiting warming to 1.5° has been exceeded.

NASA and the National Oceanic and Atmospheric Administration both place the mark at slightly below 1.5° C over pre-industrial temperatures (as defined by the 1850–1900 average). However, that difference largely reflects the uncertainties in measuring temperatures during that period rather than disagreement over 2024.

It’s hot everywhere

2023 had set a temperature record largely due to a switch to El Niño conditions midway through the year, which made the second half of the year exceptionally hot. It takes some time for that heat to make its way from the ocean into the atmosphere, so the streak of warm months continued into 2024, even as the Pacific switched into its cooler La Niña mode.

While El Niños are regular events, this one had an outsized impact because it was accompanied by unusually warm temperatures outside the Pacific, including record high temperatures in the Atlantic and unusual warmth in the Indian Ocean. Land temperatures reflect this widespread warmth, with elevated temperatures on all continents. Berkeley Earth estimates that 104 countries registered 2024 as the warmest on record, meaning 3.3 billion people felt the hottest average temperatures they had ever experienced.

Different organizations use slightly different methods to calculate the global temperature and have different baselines. For example, Copernicus puts 2024 at 0.72° C above a baseline that will be familiar to many people since they were alive for it: 1991 to 2000. In contrast, NASA and NOAA use a baseline that covers the entirety of the last century, which is substantially cooler overall. Relative to that baseline, 2024 is 1.29° C warmer.

Lining up the baselines shows that these different services largely agree with each other, with most of the differences due to uncertainties in the measurements, with the rest accounted for by slightly different methods of handling things like areas with sparse data.

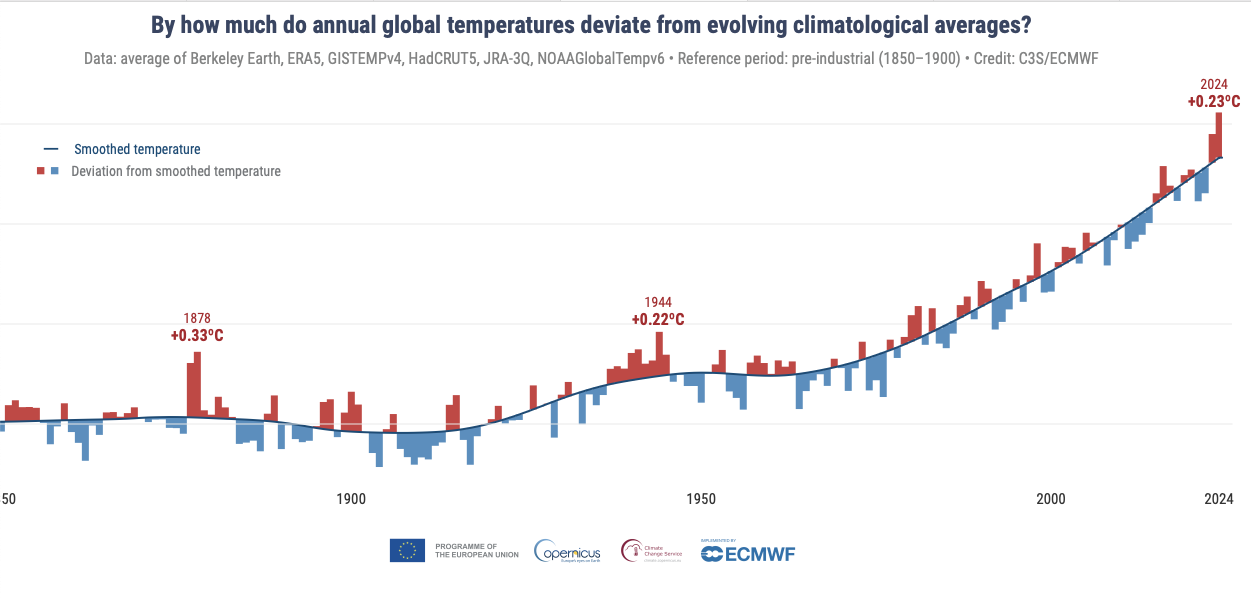
Describing the details of 2024, however, doesn’t really capture just how exceptional the warmth of the last two years has been. Starting in around 1970, there’s been a roughly linear increase in temperature driven by greenhouse gas emissions, despite many individual years that were warmer or cooler than the trend. The last two years have been extreme outliers from this trend. The last time there was a single comparable year to 2024 was back in the 1940s. The last time there were two consecutive years like this was in 1878.

A graph showing a curve that increases smoothly from left to right, with individual points on the curve hosting red and blue lines above and below. The red line at 2024 is larger than any since 1978.

Relative to the five-year temperature average, 2024 is an exceptionally large excursion. Credit: Copernicus

“These were during the ‘Great Drought’ of 1875 to 1878, when it is estimated that around 50 million people died in India, China, and parts of Africa and South America,” the EU’s Copernicus service notes. Despite many climate-driven disasters, the world at least avoided a similar experience in 2023-24.

Berkeley Earth provides a slightly different way of looking at it, comparing each year since 1970 with the amount of warming we’d expect from the cumulative greenhouse gas emissions.

A graph showing a reddish wedge, growing from left to right. A black line traces the annual temperatures, which over near the top edge of the wedge until recent years.

Relative to the expected warming from greenhouse gasses, 2024 represents a large departure. Credit: Berkeley Earth

These show that, given year-to-year variations in the climate system, warming has closely tracked expectations over five decades. 2023 and 2024 mark a dramatic departure from that track, although it comes at the end of a decade where most years were above the trend line. Berkeley Earth estimates that there’s just a 1 in 100 chance of that occurring due to the climate’s internal variability.

Is this a new trend?

The big question is whether 2024 is an exception and we should expect things to fall back to the trend that’s dominated since the 1970s, or it marks a departure from the climate’s recent behavior. And that’s something we don’t have a great answer to.

If you take away the influence of recent greenhouse gas emissions and El Niño, you can focus on other potential factors. These include a slight increase expected due to the solar cycle approaching its maximum activity. But, beyond that, most of the other factors are uncertain. The Hunga Tonga eruption put lots of water vapor into the stratosphere, but the estimated effects range from slight warming to cooling equivalent to a strong La Niña. Reductions in pollution from shipping are expected to contribute to warming, but the amount is debated.

There is evidence that a decrease in cloud cover has allowed more sunlight to be absorbed by the Earth, contributing to the planet’s warming. But clouds are typically a response to other factors that influence the climate, such as the amount of water vapor in the atmosphere and the aerosols present to seed water droplets.

It’s possible that a factor that we missed is driving the changes in cloud cover or that 2024 just saw the chaotic nature of the atmosphere result in less cloud cover. Alternatively, we may have crossed a warming tipping point, where the warmth of the atmosphere makes cloud formation less likely. Knowing that will be critical going forward, but we simply don’t have a good answer right now.

Climate goals

There’s an equally unsatisfying answer to what this means for our chance of hitting climate goals. The stretch goal of the Paris Agreement is to limit warming to 1.5° C, because it leads to significantly less severe impacts than the primary, 2.0° target. That’s relative to pre-industrial temperatures, which are defined using the 1850–1900 period, the earliest time where temperature records allow a reconstruction of the global temperature.

Unfortunately, all the organizations that handle global temperatures have some differences in the analysis methods and data used. Given recent data, these differences result in very small divergences in the estimated global temperatures. But with the far larger uncertainties in the 1850–1900 data, they tend to diverge more dramatically. As a result, each organization has a different baseline, and different anomalies relative to that.

As a result, Berkeley Earth registers 2024 as being 1.62° C above preindustrial temperatures, and Copernicus 1.60° C. In contrast, NASA and NOAA place it just under 1.5° C (1.47° and 1.46°, respectively). NASA’s Gavin Schmidt said this is “almost entirely due to the [sea surface temperature] data set being used” in constructing the temperature record.

There is, however, consensus that this isn’t especially meaningful on its own. There’s a good chance that temperatures will drop below the 1.5° mark on all the data sets within the next few years. We’ll want to see temperatures consistently exceed that mark for over a decade before we consider that we’ve passed the milestone.

That said, given that carbon emissions have barely budged in recent years, there’s little doubt that we will eventually end up clearly passing that limit (Berkeley Earth is essentially treating it as exceeded already). But there’s widespread agreement that each increment between 1.5° and 2.0° will likely increase the consequences of climate change, and any continuing emissions will make it harder to bring things back under that target in the future through methods like carbon capture and storage.

So, while we may have committed ourselves to exceed one of our major climate targets, that shouldn’t be viewed as a reason to stop trying to limit greenhouse gas emissions.

Photo of John Timmer

John is Ars Technica’s science editor. He has a Bachelor of Arts in Biochemistry from Columbia University, and a Ph.D. in Molecular and Cell Biology from the University of California, Berkeley. When physically separated from his keyboard, he tends to seek out a bicycle, or a scenic location for communing with his hiking boots.

Everyone agrees: 2024 the hottest year since the thermometer was invented Read More »
study:-warming-has-accelerated-due-to-the-earth-absorbing-more-sunlight

Study: Warming has accelerated due to the Earth absorbing more sunlight

The concept of an atmospheric energy imbalance is pretty straightforward: We can measure both the amount of energy the Earth receives from the Sun and how much energy it radiates back into space. Any difference between the two results in a net energy imbalance that’s either absorbed by or extracted from the ocean/atmosphere system. And we’ve been tracking it via satellite for a while now as rising greenhouse gas levels have gradually increased the imbalance.

But greenhouse gases aren’t the only thing having an effect. For example, the imbalance has also increased in the Arctic due to the loss of snow cover and retreat of sea ice. The dark ground and ocean absorb more solar energy compared to the white material that had previously been exposed to the sunlight. Not all of this is felt directly, however, as a lot of the areas where it’s happening are frequently covered by clouds.

Nevertheless, the loss of snow and ice has caused the Earth’s reflectivity, termed its albedo, to decline since the 1970s, enhancing the warming a bit.

Vanishing clouds

The new paper finds that the energy imbalance set a new high in 2023, with a record amount of energy being absorbed by the ocean/atmosphere system. This wasn’t accompanied by a drop in infrared emissions from the Earth, suggesting it wasn’t due to greenhouse gases, which trap heat by absorbing this radiation. Instead, it seems to be due to decreased reflection of incoming sunlight by the Earth.

While there was a general trend in that direction, the planet set a new record low for albedo in 2023. Using two different data sets, the teams identify the areas most effected by this, and they’re not at the poles, indicating loss of snow and ice are unlikely to be the cause. Instead, the key contributor appears to be the loss of low-level clouds. “The cloud-related albedo reduction is apparently largely due to a pronounced decline of low-level clouds over the northern mid-latitude and tropical oceans, in particular the Atlantic,” the researchers say.

Study: Warming has accelerated due to the Earth absorbing more sunlight Read More »

with-four-more-years-like-2023,-carbon-emissions-will-blow-past-1.5°-limit

With four more years like 2023, carbon emissions will blow past 1.5° limit

One way to look at how problematic this is would be to think in terms of a carbon budget. We can estimate how much carbon can be put into the atmosphere before warming reaches 1.5° C. Subtract the emissions we’ve already added, and you get the remaining budget. At this point, the remaining budget for 1.5° C is only 200 Gigatonnes, which means another four years like 2023 will leave us well beyond our budget. For the 2° C budget, we’ve got less than 20 years like 2023 before we go past.

An alternate way to look at the challenge is to consider the emissions reductions that would get us on track. UNEP uses 2019 emissions as a baseline (about 52 Gigatonnes) and determined that, in 2030, we’d need to have emissions cut by 28 percent to get onto the 2° C target, and by 42 percent to be on track for the 1.5° C target.

The NDCs are nowhere close to that, with even the conditional pledges being sufficient to only cut emissions by 10 percent. Ideally, that should be prompting participating nations to be rapidly updating their NDCs to get them better aligned with our stated goals. And, while 90 percent have done so since the signing of the Paris Agreement, only a single country has made updated pledges over the past year.

Countries are also failing to keep their national policies in line with their NDCs. The UNEP report estimates that current policies allow the world collectively to emit two Gigatonnes more than their pledges would see being released.

A limited number of countries are responsible for the huge gap between where we need to go and what we’re actually doing. Nearly two-thirds of 2023’s emissions come from just six countries: China, the US, India, the EU, Russia, and Brazil. By contrast, the 55 nations of the African Union are only producing about 6 percent of the global emissions. Obviously, this means that any actions taken by these six entities will have a disproportionate effect on future emissions. The good news is that at least two of those, the EU and US, saw emissions drop over the year prior (by 7.5 percent in the EU, and 1.4 percent in the US), while Brazil remained largely unchanged.

With four more years like 2023, carbon emissions will blow past 1.5° limit Read More »

climate-wise,-it-was-a-full-year-of-exceptional-months

Climate-wise, it was a full year of exceptional months

Every month is above average —

Last June was the warmest June on record. Every month since has been similar.

A red and orange background, with a thermometer representing extreme heat in the center.

June 2023 did not seem like an exceptional month at the time. It was the warmest June in the instrumental temperature record, but monthly records haven’t exactly been unusual in a period where the top 10 warmest years on record have all occurred within the last 15 years. And monthly records have often occurred in years that are otherwise unexceptional; at the time, the warmest July on record had occurred in 2019, a year that doesn’t stand out much from the rest of the past decade.

But July 2023 set another monthly record, easily eclipsing 2019’s high temperatures. Then August set yet another monthly record. And so has every single month since, a string of records that propelled 2023 to the warmest year since we started keeping track.

Yesterday, the European Union’s Copernicus Earth-monitoring service announced that we’ve now gone a full year where every single month has been the warmest version of that month since we’ve had enough instruments in place to track global temperatures.

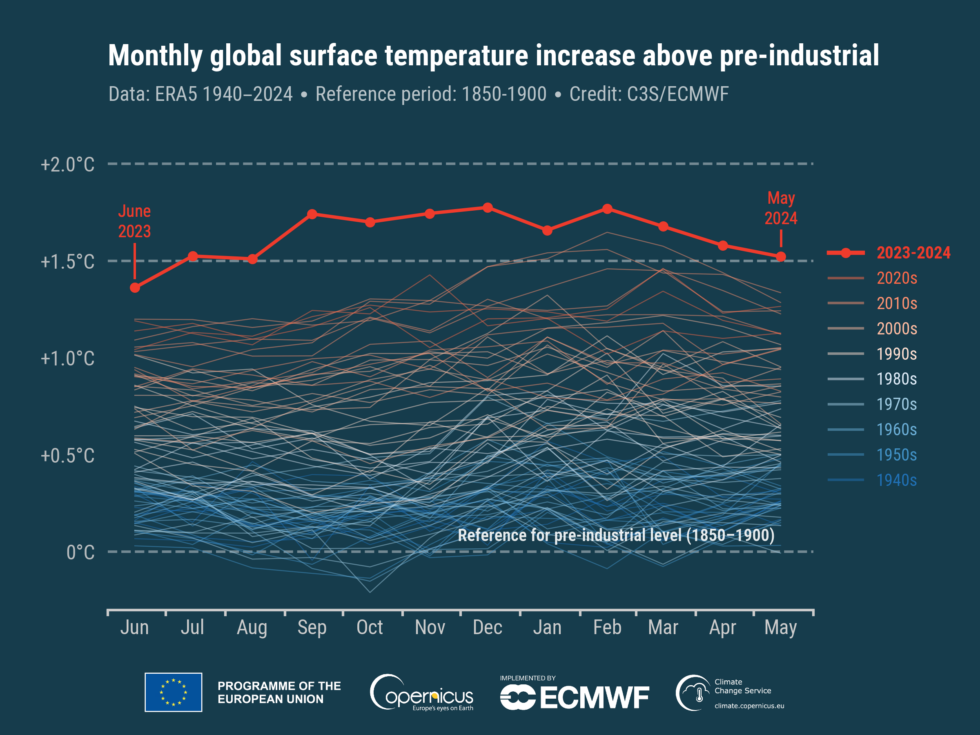
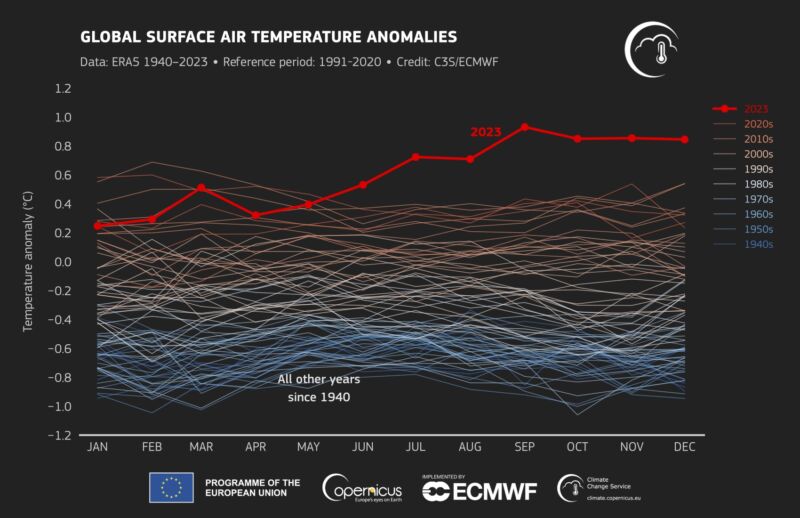
History monthly temperatures show just how extreme the temperatures have been over the last year.

Enlarge / History monthly temperatures show just how extreme the temperatures have been over the last year.

As you can see from this graph, most years feature a mix of temperatures, some higher than average, some lower. Exceptionally high months tend to cluster, but those clusters also tend to be shorter than a full year.

In the Copernicus data, a similar year-long streak of records happened once before (recently, in 2015/2016). NASA, which uses slightly different data and methods, doesn’t show a similar streak in that earlier period. NASA hasn’t released its results for May’s temperatures yet—they’re expected in the next few days. But it’s very likely that NASA will also show a year-long streak of records.

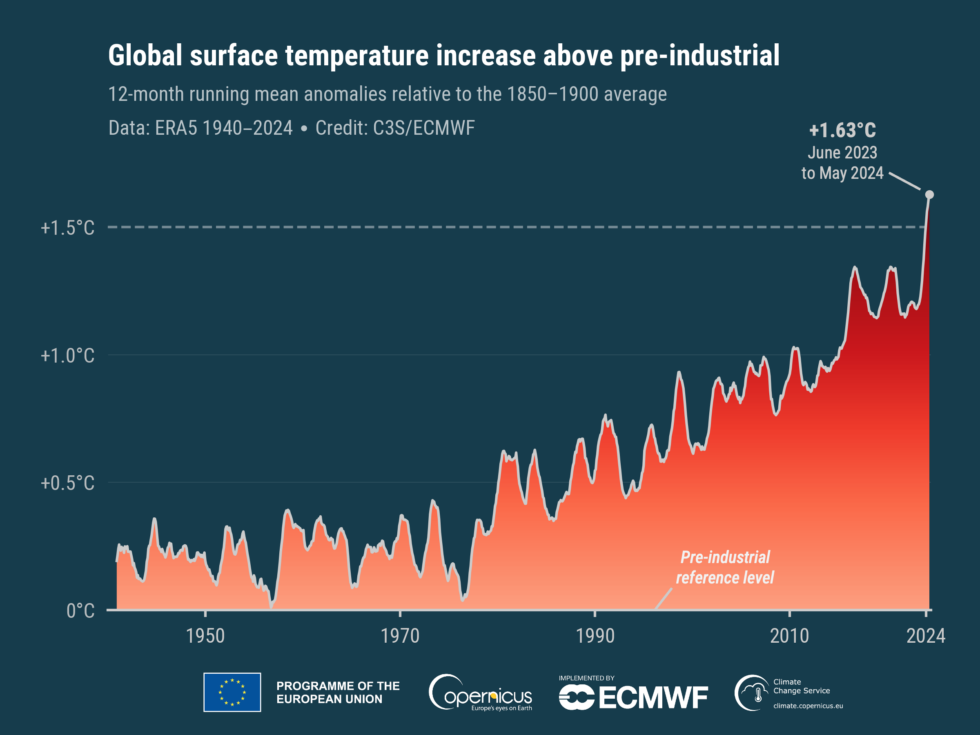
Beyond records, the EU is highlighting the fact that the one-year period ending in May was 1.63° C above the average temperatures of the 1850–1900 period, which are used as a baseline for preindustrial temperatures. That’s notable because many countries have ostensibly pledged to try to keep temperatures from exceeding 1.5° above preindustrial conditions by the end of the century. While it’s likely that temperatures will drop below the target again at some point within the next few years, the new records suggest that we have a very limited amount of time before temperatures persistently exceed it.

For the first time on record, temperatures have held steadily in excess of 1.5º above the preindustrial average.

Enlarge / For the first time on record, temperatures have held steadily in excess of 1.5º above the preindustrial average.

Realistically, those plans involve overshooting the 1.5° C target by midcentury but using carbon capture technology to draw down greenhouse gas levels. Exceeding that target earlier will mean that we have more carbon dioxide to pull out of the atmosphere, using technology that hasn’t been demonstrated anywhere close to the scale that we’ll need. Plus, it’s unclear who will pay for the carbon removal.

The extremity of some of the monthly records—some months have come in a half-degree C above any earlier month—are also causing scientists to look for reasons. But so far, the field hasn’t come to a consensus regarding the sudden surge in temperature extremes.

Because it has been accompanied by significant warming of ocean temperatures, a lot of attention has focused on changes to pollution rules for international shipping, which are meant to reduce sulfur emissions. These went into effect recently and have cut down on the emission of aerosols by cargo vessels, reducing the amount of sunlight that’s reflected back to space.

That’s considered likely to be a partial contributor. A slight contribution may have also come from the Hunga Tonga eruption, which blasted significant amounts of water vapor into the upper atmosphere, though nowhere near enough to explain this warming. Beyond that, there are no obvious explanations for the recent warmth.

Climate-wise, it was a full year of exceptional months Read More »

skyrocketing-ocean-temperatures-have-scientists-scratching-their-heads

Skyrocketing ocean temperatures have scientists scratching their heads

beach scene with thermometer

jay_zynism via Getty

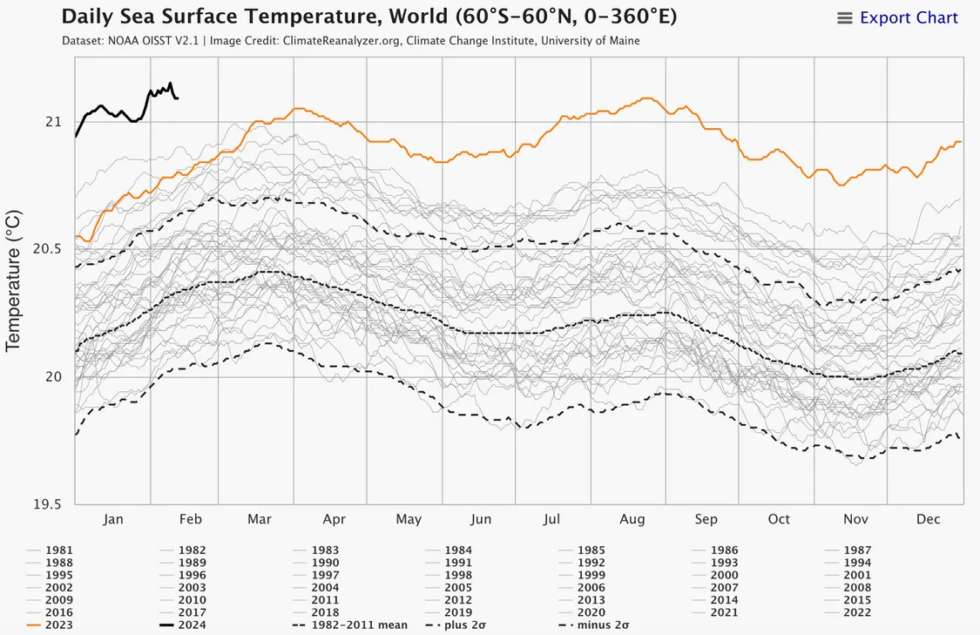
For nearly a year now, a bizarre heating event has been unfolding across the world’s oceans. In March 2023, global sea surface temperatures started shattering record daily highs and have stayed that way since.

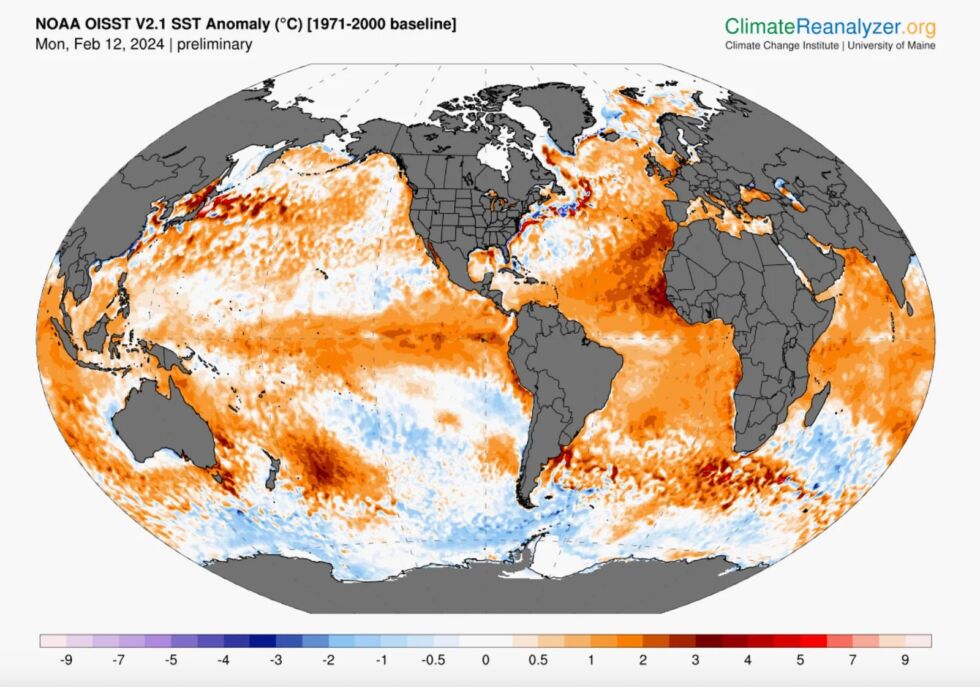
You can see 2023 in the orange line below, the other gray lines being previous years. That solid black line is where we are so far in 2024—way, way above even 2023. While we’re nowhere near the Atlantic hurricane season yet—that runs from June 1 through the autumn—keep in mind that cyclones feed on warm ocean water, which could well stay anomalously hot in the coming months. Regardless, these surface temperature anomalies could be triggering major ecological problems already.

“In the tropical eastern Atlantic, it’s four months ahead of pace—it’s looking like it’s already June out there,” says Brian McNoldy, a hurricane researcher at the University of Miami. “It’s really getting to be strange that we’re just seeing the records break by this much, and for this long.”

You’ll notice from these graphs and maps that the temperature anomalies may be a degree or two Celsius warmer, which may not sound like much. But for the seas, it really is: Unlike land, which rapidly heats and cools as day turns to night and back again, it takes a lot to warm up an ocean that may be thousands of feet deep. So even an anomaly of mere fractions of a degree is significant. “To get into the two or three or four degrees, like it is in a few places, it’s pretty exceptional,” says McNoldy.

University of Maine

So what’s going on here? For one, the oceans have been steadily warming over the decades, absorbing something like 90 percent of the extra heat that humans have added to the atmosphere. “The oceans are our saviors, in a way,” says biological oceanographer Francisco Chavez of the Monterey Bay Aquarium Research Institute in California. “Things might be a lot worse in terms of climate impacts, because a lot of that heat is not only kept at the surface, it’s taken to depths.”

A major concern with such warm surface temperatures is the health of the ecosystems floating there: phytoplankton that bloom by soaking up the sun’s energy and the tiny zooplankton that feed on them. If temperatures get too high, certain species might suffer, shaking the foundations of the ocean food web.

Skyrocketing ocean temperatures have scientists scratching their heads Read More »

nasa-scientist-on-2023-temperatures:-“we’re-frankly-astonished”

NASA scientist on 2023 temperatures: “We’re frankly astonished”

Extremely unusual —

NASA, NOAA, and Berkeley Earth have released their takes on 2023’s record heat.

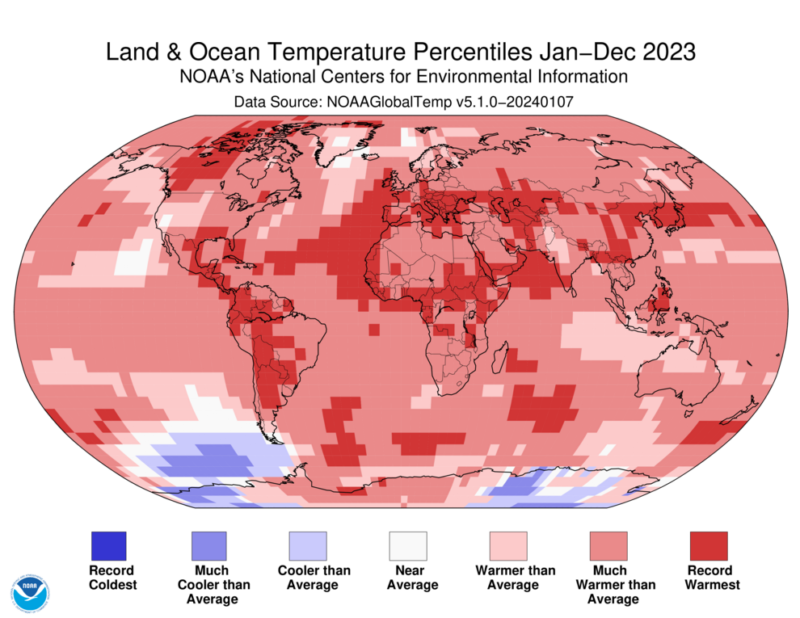
A global projection map with warm areas shown in read, and color ones in blue. There is almost no blue.

Enlarge / Warming in 2023 was widespread.

Earlier this week, the European Union’s Earth science team came out with its analysis of 2023’s global temperatures, finding it was the warmest year on record to date. In an era of global warming, that’s not especially surprising. What was unusual was how 2023 set its record—every month from June on coming in far above any equivalent month in the past—and the size of the gap between 2023 and any previous year on record.

The Copernicus dataset used for that analysis isn’t the only one of the sort, and on Friday, Berkeley Earth, NASA, and the National Oceanic and Atmospheric Administration all released equivalent reports. And all of them largely agree with the EU’s: 2023 was a record, and an unusual one at that. So unusual that NASA’s chief climate scientist, Gavin Schmidt, introduced his look at 2023 by saying, “We’re frankly astonished.”

Despite the overlaps with the earlier analysis, each of the three new ones adds some details that flesh out what made last year so unusual.

Each of the three analyses uses slightly different methods to do things like fill in areas of the globe where records are sparse, and uses a different baseline. Berkeley Earth was the only team to do a comparison with pre-industrial temperatures, using a baseline of the 1850–1900 temperatures. Its analysis suggests that this is the first year to finish over 1.5° C above preindustrial temperatures.

Most countries have committed to an attempt to keep temperatures from consistently coming in above that point. So, at one year, we’re far from consistently failing our goals. But there’s every reason to expect that we’re going to see several more years exceeding this point before the decade is out. And that clearly means we have a very short timeframe before we get carbon emissions to drop, or we’ll commit to facing a difficult struggle to get temperatures back under this threshold by the end of the century.

Berkeley Earth also noted that the warming was extremely widespread. It estimates that nearly a third of the Earth’s population lived in a region that set a local heat record. And 77 nations saw 2023 set a national record.

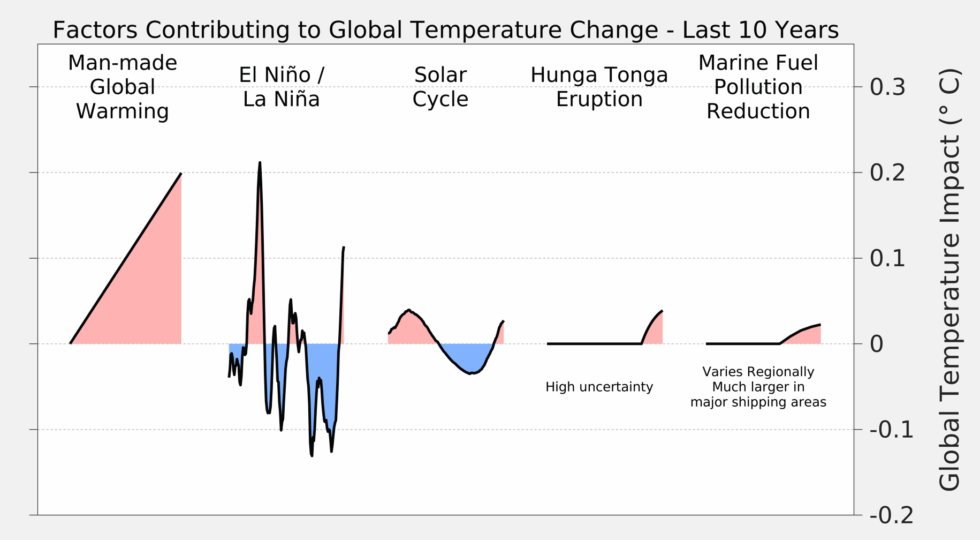
Lots of factors converged on warming in 2023.

Enlarge / Lots of factors converged on warming in 2023.

The Berkeley team also had a nice graph laying out the influences of different factors on recent warming. Greenhouse gases are obviously the strongest and most consistent factor, but there are weaker short-term influences as well, such as the El Niño/La Niña oscillation and the solar cycle. Berkeley Earth and EU’s Copernicus also noted that an international agreement caused sulfur emissions from shipping to drop by about 85 percent in 2020, which would reduce the amount of sunlight scattered back out into space. Finally, like the EU team, they note the Hunga Tonga eruption.

An El Niño unlike any other

A shift from La Niño to El Niño conditions in the late spring is highlighted by everyone looking at this year, as El Niños tend to drive global temperatures upward. While it has the potential to develop into a strong El Niño in 2024, at the moment, it’s pretty mild. So why are we seeing record temperatures?

We’re not entirely sure. “The El Niño we’ve seen is not an exceptional one,” said NASA’s Schmidt. So, he reasoned, “Either this El Niño is different from all of them… or there are other factors going on.” But he was at a bit of a loss to identify the factors. He said that typically, there are a limited number of stories that you keep choosing from in order to explain a given year’s behavior. But, for 2023, none of them really fit.

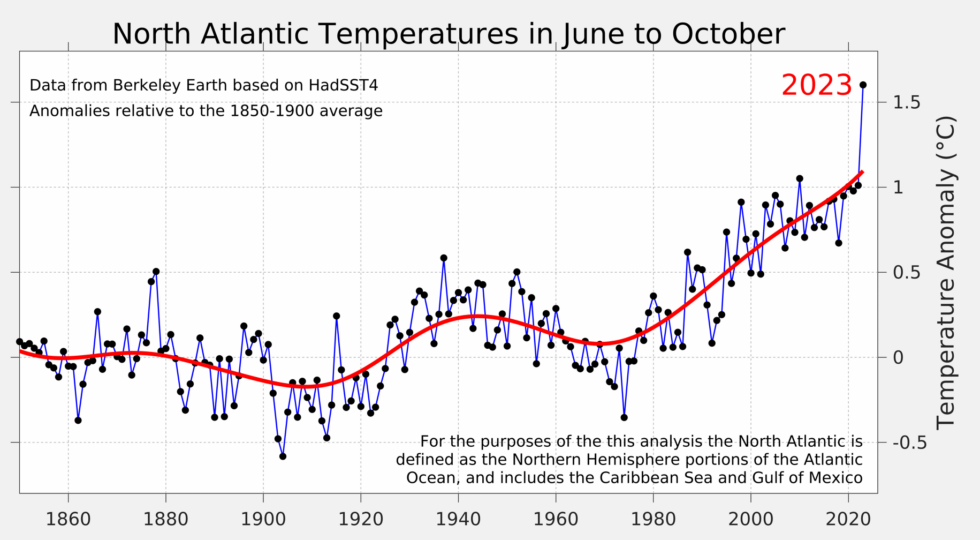
Something very ominous happened to the North Atlantic last year.

Enlarge / Something very ominous happened to the North Atlantic last year.

Berkeley Earth had a great example of it in its graph of North Atlantic sea surface temperatures, which have been rising slowly for decades, until 2023 saw record temperatures with a freakishly large gap compared to anything previously on record. There’s nothing especially obvious to explain that.

Lurking in the background of all of this is climate scientist James Hansen’s argument that we’re about to enter a new regime of global warming, where temperatures increase at a much faster pace than they have until now. Most climate scientists don’t see compelling evidence for that yet. And, with El Niño conditions likely to prevail for much of 2024, we can expect a very hot year again, regardless of changing trends. So, it may take several more years to determine if 2023 was a one-off freak or a sign of new trends.

NASA scientist on 2023 temperatures: “We’re frankly astonished” Read More »

first-results-are-in:-2023-temperatures-were-stunningly-warm

First results are in: 2023 temperatures were stunningly warm

Here we go again —

In the second half of the year, every month set a record.

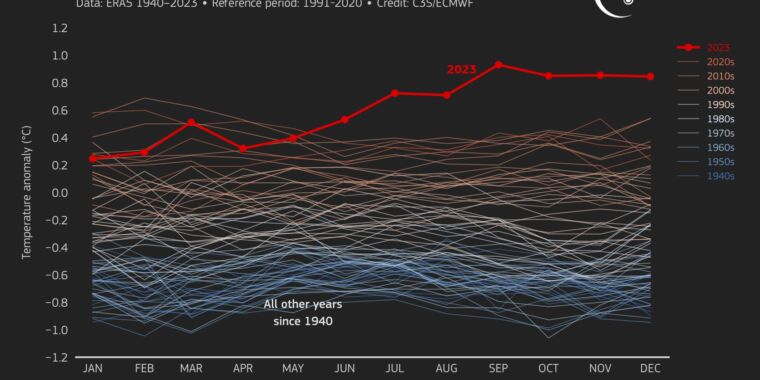
Image of a lot of squiggly lines moving from left to right across a graph, with one line in red standing far above the rest.

Enlarge / Month by month, 2023 stood far above the rest.

The confused wiggles on the graph above have a simple message: Most years, even years with record-high temperatures, have some months that aren’t especially unusual. Month to month, temperatures dip and rise, with the record years mostly being a matter of having fewer, shallower dips.

As the graph shows, last year was not at all like that. The first few months of the year were unusually warm. And then, starting in June, temperatures rose to record heights and simply stayed there. Every month after June set a new record for high temperatures for that month. So it’s not surprising that 2023 will enter the record books as far and away the warmest year on record.

The EU makes it official

Several different organizations maintain global temperature records; while they use slightly different methods, they tend to produce very similar numbers. So, over the next few weeks, you can expect each of these organizations to announce record temperatures (NASA and the National Oceanic and Atmospheric Administration will do so on Friday). On Tuesday, it was the European Union’s turn, via its Copernicus Earth-observation program.

Copernicus rates 2023 as being nearly 1.5° C above pre-industrial temperatures and about 0.17° C above 2016, the previous holder of the warmest year on record. The difference between 2023 and 2022 was the largest single-year change in the record as well, confirming that the amount of warming this past year was exceptional.

The 1.5° C landmark is significant because many countries have committed to trying to limit global warming to that mark. This doesn’t mean we’ve failed; the average temperature for the last decade is still below that. But it does highlight how little time we have left to act before we potentially experience more radical consequences of climate change.

The Copernicus analysis notes a couple of additional daily landmarks within the yearly record. It defines pre-industrial temperatures as those experienced between 1850–1900. The records from this period are sparse enough that, rather than daily temperature data, it’s been handled as a monthly average. So, the best Copernicus could do is compare 2023’s daily temperatures to the equivalent month in the pre-industrial record.

Even given that limitation, some of the results of this comparison were striking. For the first time ever, individual days in 2023 were 2.0° C above the preindustrial monthly average. Nearly half the days in 2023 were 1.5° C warmer than preindustrial records, and it was the first time every day was at least 1.0° C warmer.

Why so extreme?

The simplest answer is El Niño. The past few years have been spent in a reasonably strong La Niña, the cooler phase of the Southern Oscillation. But that started fading throughout the spring, and by mid-year, a weak El Niño had arrived. Normally, a relatively feeble El Niño like this would have a limited effect on global temperatures, and in any case, it would normally take some time for its effect to be felt in global temperatures.

Red means hot: last year saw a strong La Niña come to a close, with conditions shifting to a slight El Niño.

Red means hot: last year saw a strong La Niña come to a close, with conditions shifting to a slight El Niño.

But with temperatures poised near record levels to begin with, just a little push appeared to be all 2023 needed to soar to record heights.

Still, there are plenty of indications that the year wasn’t only the result of El Niño, which is a phenomenon that occurs in the tropical Pacific. For example, the North Atlantic, which is not directly connected to the Tropical Pacific, experienced exceptionally warm sea surface temperatures over the second half of the year.

Copernicus suggests that several additional, weak factors could have contributed to the year’s warmth. These include lower emissions of cooling aerosols from shipping, a peak in the solar cycle, and high levels of water vapor in the stratosphere due to the eruption of the Hunga Tonga volcano. On its own, the impact of any of these would likely be minimal. In combination with the weak El Niño and the continued emission of greenhouse gasses, however, they might have enhanced what was already an exceptionally warm year.

The announcement of 2023’s warmth comes only months after a set of UN climate negotiations that many have derided as lacking the sort of urgency the record might have provided. Instead, Copernicus notes that carbon dioxide and methane emissions increased last year.

Listing image by Marco Bottigelli

First results are in: 2023 temperatures were stunningly warm Read More »