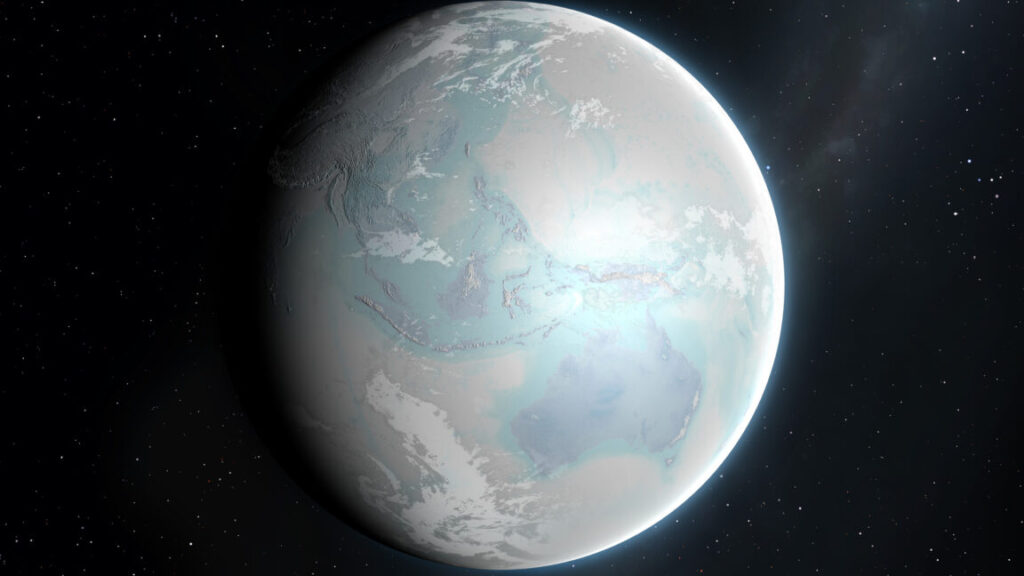
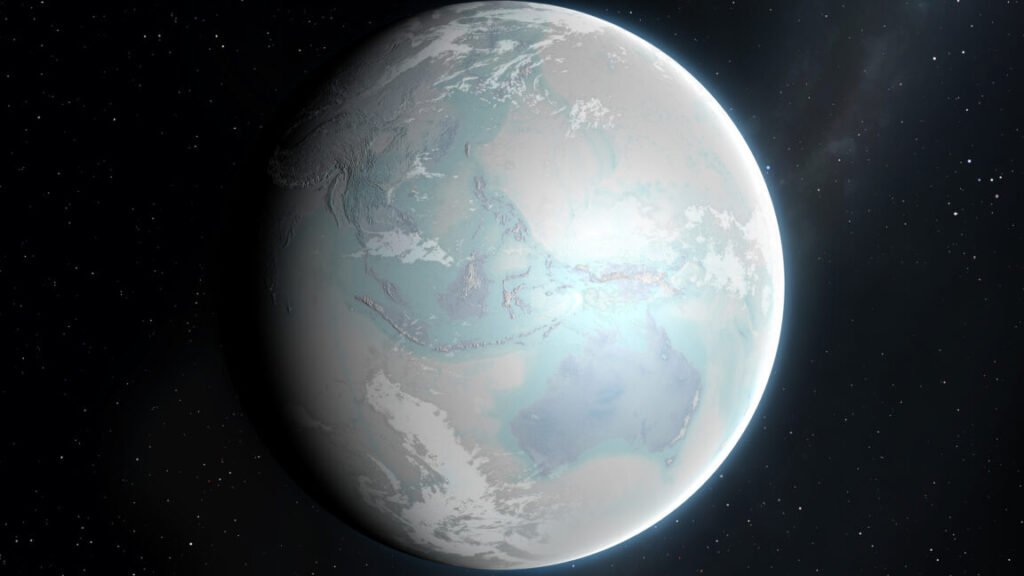
All of which raises questions about what the snowball Earth might have looked like in the continental interiors. A team of US-based geologists think they’ve found some glacial deposits in the form of what are called the Tavakaiv sandstones in Colorado. These sandstones are found along the Front Range of the Rockies, including areas just west of Colorado Springs. And, if the authors’ interpretations are correct, they formed underneath a massive sheet of glacial ice.
There are lots of ways to form sandstone deposits, and they can be difficult to date because they’re aggregates of the remains of much older rocks. But in this case, the Tavakaiv sandstone is interrupted by intrusions of dark colored rock that contains quartz and large amounts of hematite, a form of iron oxide.
These intrusions tell us a remarkable number of things. For one, some process must have exerted enough force to drive material into small faults in the sandstone. Hematite only gets deposited under fairly specific conditions, which tells us a bit more. And, most critically, hematite can trap uranium and the lead it decays into, providing a way of dating when the deposits formed.
Under the snowball
Depending on which site was being sampled, the hematite produced a range of dates, from as recent as 660 million years ago to as old as 700 million years. That means all of them were formed during what’s termed the Sturtian glaciation, which ran from 715 million to 660 million years ago. At the time, the core of what is now North America was in the equatorial region. So, the Tavakaiv sandstones can provide a window into what at least one continent experienced during the most severe global glaciation of the Cryogenian Period.
Earthquake scientists detected an unusual signal on monitoring stations used to detect seismic activity during September 2023. We saw it on sensors everywhere, from the Arctic to Antarctica.
We were baffled—the signal was unlike any previously recorded. Instead of the frequency-rich rumble typical of earthquakes, this was a monotonous hum, containing only a single vibration frequency. Even more puzzling was that the signal kept going for nine days.
Initially classified as a “USO”—an unidentified seismic object—the source of the signal was eventually traced back to a massive landslide in Greenland’s remote Dickson Fjord. A staggering volume of rock and ice, enough to fill 10,000 Olympic-sized swimming pools, plunged into the fjord, triggering a 200-meter-high mega-tsunami and a phenomenon known as a seiche: a wave in the icy fjord that continued to slosh back and forth, some 10,000 times over nine days.
To put the tsunami in context, that 200-meter wave was double the height of the tower that houses Big Ben in London and many times higher than anything recorded after massive undersea earthquakes in Indonesia in 2004 (the Boxing Day tsunami) or Japan in 2011 (the tsunami which hit Fukushima nuclear plant). It was perhaps the tallest wave anywhere on Earth since 1980.
Our discovery, now published in the journal Science, relied on collaboration with 66 other scientists from 40 institutions across 15 countries. Much like an air crash investigation, solving this mystery required putting many diverse pieces of evidence together, from a treasure trove of seismic data, to satellite imagery, in-fjord water level monitors, and detailed simulations of how the tsunami wave evolved.
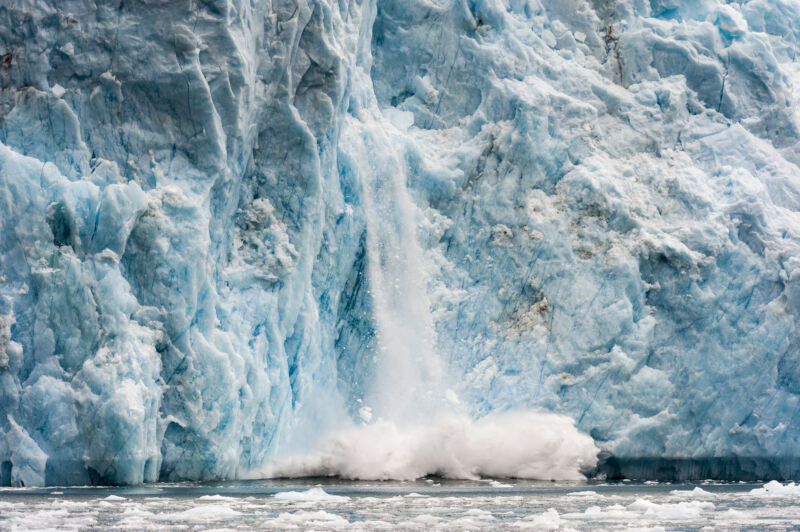
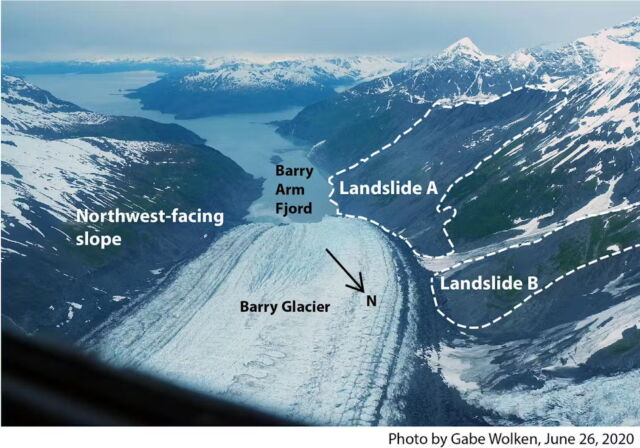
This all highlighted a catastrophic, cascading chain of events, from decades to seconds before the collapse. The landslide traveled down a very steep glacier in a narrow gully before plunging into a narrow, confined fjord. Ultimately, though, it was decades of global heating that had thinned the glacier by several tens of meters, meaning that the mountain towering above it could no longer be held up.
Uncharted waters
But beyond the weirdness of this scientific marvel, this event underscores a deeper and more unsettling truth: climate change is reshaping our planet and our scientific methods in ways we are only beginning to understand.
It is a stark reminder that we are navigating uncharted waters. Just a year ago, the idea that a seiche could persist for nine days would have been dismissed as absurd. Similarly, a century ago, the notion that warming could destabilize slopes in the Arctic, leading to massive landslides and tsunamis happening almost yearly, would have been considered far-fetched. Yet, these once-unthinkable events are now becoming our newreality.
As we move deeper into this new era, we can expect to witness more phenomena that defy our previous understanding, simply because our experience does not encompass the extreme conditions we are now encountering. We found a nine-day wave that previously no one could imagine could exist.
Traditionally, discussions about climate change have focused on us looking upwards and outwards to the atmosphere and to the oceans with shifting weather patterns, and rising sea levels. But Dickson Fjord forces us to look downward, to the very crust beneath our feet.
For perhaps the first time, climate change has triggered a seismic event with global implications. The landslide in Greenland sent vibrations through the Earth, shaking the planet and generating seismic waves that traveled all around the globe within an hour of the event. No piece of ground beneath our feet was immune to these vibrations, metaphorically opening up fissures in our understanding of these events.
This will happen again
Although landslide-tsunamis have been recorded before, the one in September 2023 was the first ever seen in east Greenland, an area that had appeared immune to these catastrophic climate change induced events.
This certainly won’t be the last such landslide-megatsunami. As permafrost on steep slopes continues to warm and glaciers continue to thin, we can expect these events to happen more often and on an even bigger scale across the world’s polar and mountainous regions. Recently identified unstable slopes in west Greenland and in Alaska are clear examples of looming disasters.
As we confront these extreme and unexpected events, it is becoming clear that our existing scientific methods and toolkits may need to be fully equipped to deal with them. We had no standard workflow to analyze the 2023 Greenland event. We also must adopt a new mindset because our current understanding is shaped by a now near-extinct, previously stable climate.
As we continue to alter our planet’s climate, we must be prepared for unexpected phenomena that challenge our current understanding and demand new ways of thinking. The ground beneath us is shaking, both literally and figuratively. While the scientific community must adapt and pave the way for informed decisions, it’s up to decision-makers to act.
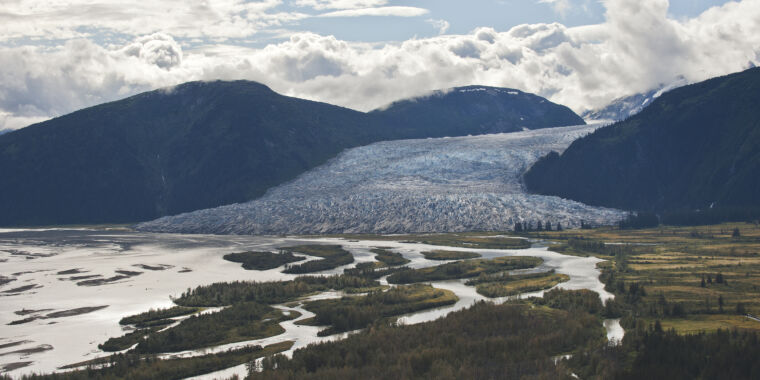
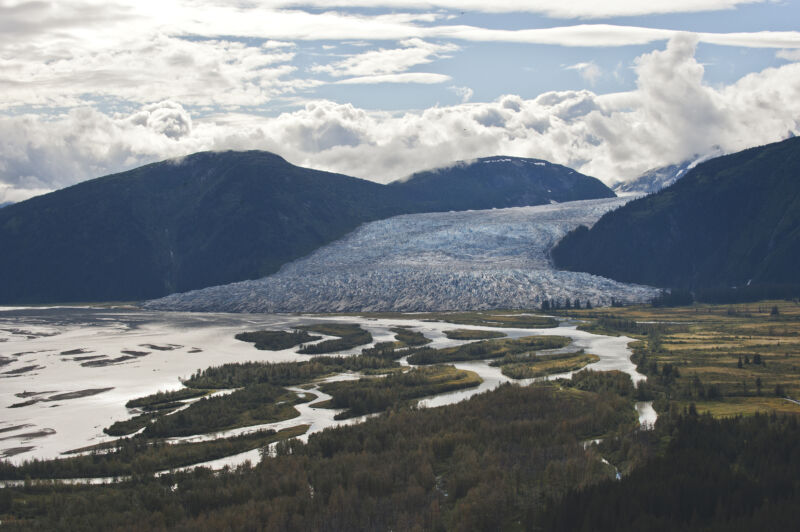
The melting of one of North America’s largest ice fields has accelerated and could soon reach an irreversible tipping point. That’s the conclusion of new research colleagues and I have published on the Juneau Icefield, which straddles the Alaska-Canada border near the Alaskan capital of Juneau.
In the summer of 2022, I skied across the flat, smooth, and white plateau of the icefield, accompanied by other researchers, sliding in the tracks of the person in front of me under a hot sun. From that plateau, around 40 huge, interconnected glaciers descend towards the sea, with hundreds of smaller glaciers on the mountain peaks all around.
Our work, now published in Nature Communications, has shown that Juneau is an example of a climate “feedback” in action: as temperatures are rising, less and less snow is remaining through the summer (technically: the “end-of-summer snowline” is rising). This in turn leads to ice being exposed to sunshine and higher temperatures, which means more melt, less snow, and so on.
Like many Alaskan glaciers, Juneau’s are top-heavy, with lots of ice and snow at high altitudes above the end-of-summer snowline. This previously sustained the glacier tongues lower down. But when the end-of-summer snowline does creep up to the top plateau, then suddenly a large amount of a top-heavy glacier will be newly exposed to melting.
That’s what’s happening now, each summer, and the glaciers are melting much faster than before, causing the icefield to get thinner and thinner and the plateau to get lower and lower. Once a threshold is passed, these feedbacks can accelerate melt and drive a self-perpetuating loss of snow and ice which would continue even if the world were to stop warming.
Ice is melting faster than ever
Using satellites, photos and old piles of rocks, we were able to measure the ice loss across Juneau Icefield from the end of the last “Little Ice Age” (about 250 years ago) to the present day. We saw that the glaciers began shrinking after that cold period ended in about 1770. This ice loss remained constant until about 1979, when it accelerated. It accelerated again in 2010, doubling the previous rate. Glaciers there shrank five times faster between 2015 and 2019 than from 1979 to 1990.
Our data shows that as the snow decreases and the summer melt season lengthens, the icefield is darkening. Fresh, white snow is very reflective, and much of that strong solar energy that we experienced in the summer of 2022 is reflected back into space. But the end of summer snowline is rising and is now often occurring right on the plateau of the Juneau Icefield, which means that older snow and glacier ice is being exposed to the sun. These slightly darker surfaces absorb more energy, increasing snow and ice melt.
As the plateau of the icefield thins, ice and snow reserves at higher altitudes are lost, and the surface of the plateau lowers. This will make it increasingly hard for the icefield to ever stabilise or even recover. That’s because warmer air at low elevations drives further melt, leading to an irreversible tipping point.
Longer-term data like these are critical to understand how glaciers behave, and the processes and tipping points that exist within individual glaciers. These complex processes make it difficult to predict how a glacier will behave in future.
The world’s hardest jigsaw
We used satellite records to reconstruct how big the glacier was and how it behaved, but this really limits us to the past 50 years. To go back further, we need different methods. To go back 250 years, we mapped the ridges of moraines, which are large piles of debris deposited at the glacier snout, and places where glaciers have scoured and polished the bedrock.
To check and build on our mapping, we spent two weeks on the icefield itself and two weeks in the rainforest below. We camped among the moraine ridges, suspending our food high in the air to keep it safe from bears, shouting to warn off the moose and bears as we bushwhacked through the rainforest, and battling mosquitoes thirsty for our blood.
We used aerial photographs to reconstruct the icefield in the 1940s and 1970s, in the era before readily available satellite imagery. These are high-quality photos but they were taken before global positioning systems made it easy to locate exactly where they were taken.
A number also had some minor damage in the intervening years—some Sellotape, a tear, a thumbprint. As a result, the individual images had to be stitched together to make a 3D picture of the whole icefield. It was all rather like doing the world’s hardest jigsaw puzzle.
Work like this is crucial as the world’s glaciers are melting fast—all together they are currently losing more mass than the Greenland or Antarctic ice sheets, and thinning rates of these glaciers worldwide has doubled over the past two decades.
Our longer time series shows just how stark this acceleration is. Understanding how and where “feedbacks” are making glaciers melt even faster is essential to make better predictions of future change in this important region
Freshwater is perhaps the world’s most essential resource, but climate change is enhancing its scarcity. An unexpected source may have the potential to provide some relief: offshore aquifers, giant undersea bodies of rock or sediment that hold and transport freshwater. But researchers don’t know how the water gets there, a question that needs to be resolved if we want to understand how to manage the water stored in them.
For decades, scientists have known about an aquifer off the US East Coast. It stretches from Martha’s Vineyard to New Jersey and holds almost as much water as two Lake Ontarios. Research presented at the American Geophysical Union conference in December attempted to explain where the water came from—a key step in finding out where other undersea aquifers lie hidden around the world.
As we discover and study more of them, offshore aquifers might become an unlikely resource for drinking water. Learning the water’s source can tell us if these freshwater reserves rebuild slowly over time or are a one-time-only emergency supply.
Reconstructing history
When ice sheets sat along the East Coast and the sea level was significantly lower than it is today, the coastline was around 100 kilometers further out to sea. Over time, freshwater filled small pockets in the open, sandy ground. Then, 10,000 years ago, the planet warmed, and sea levels rose, trapping the freshwater in the giant Continental Shelf Aquifer. But how that water came to be on the continental shelf in the first place is a mystery.
New Mexico Institute of Mining and Technology paleo-hydrogeologist Mark Person has been studying the aquifer since 1991. In the past three decades, he said, scientists’ understanding of the aquifer’s size, volume, and age has massively expanded. But they haven’t yet nailed down the water’s source, which could reveal where other submerged aquifers are hiding—if we learn the conditions that filled this one, we could look for other locations that had similar conditions.
“We can’t reenact Earth history,” Person said. Without the ability to conduct controlled experiments, scientists often resort to modeling to determine how geological structures formed millions of years ago. “It’s sort of like forensic workers looking at a crime scene,” he said.
Person developed three two-dimensional models of the offshore aquifer using seismic data and sediment and water samples from boreholes drilled onshore. Two models involved ice sheets melting; one did not.
Then, to corroborate the models, Person turned to isotopes—atoms with the same number of protons but different numbers of neutrons. Water mostly contains Oxygen-16, a lighter form of oxygen with two fewer neutrons than Oxygen-18.
Throughout the last million years, a cycle of planetary warming and cooling occurred every 100,000 years. During warming, the lighter 16O in the oceans evaporated into the atmosphere at a higher rate than the heavier 18O. During cooling, that lighter oxygen came down as snow, forming ice sheets with lower levels of 18O and leaving behind oceans with higher levels of 18O.
To determine if ice sheets played a role in forming the Continental Shelf Aquifer, Person explained, you have to look for water that is depleted in 18O—a sure sign that it came from ice sheets melting at their base. Person’s team used existing global isotope records from the shells of deep-ocean-dwelling animals near the aquifer. (The shells contain carbonate, an ion that includes oxygen pulled from the water).
Person then incorporated methods developed by a Columbia graduate student in 2019 that involve using electromagnetic imaging to finely map undersea aquifers. Since saltwater is more electrically conductive than freshwater, the boundaries between the two kinds of water are clear when electromagnetic pulses are sent through the seafloor: saltwater conducts the signal well, and freshwater doesn’t. What results looks sort of like a heat map, showing regions where fresh and saltwater are concentrated.
Person compared the electromagnetic and isotope data with his models to see which historical scenarios (ice or no ice) were statistically likely to form an aquifer that matched all the data. His results, which are in the review stage with the Geological Society of America Bulletin, suggest it’s very likely that ice sheets played a role in forming the aquifer.
“There’s a lot of uncertainty,” Person said, but “it’s the best thing we have going.”