Town urges curfew over mosquito-spread disease that kills up to 50% of people
“Critical risk” —
Eastern Equine Encephalitis is very rare in the US, but when it strikes, it’s bad.

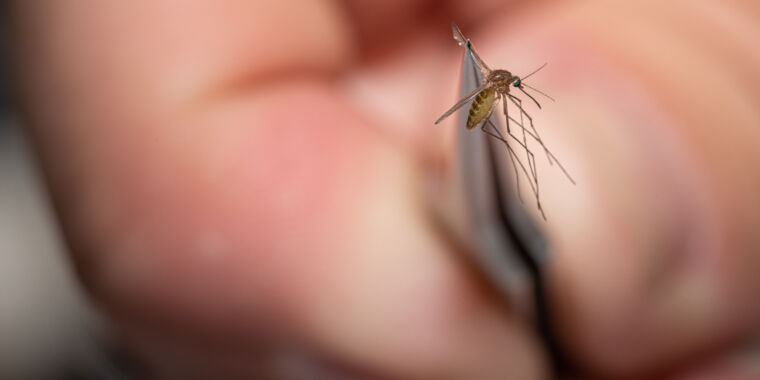
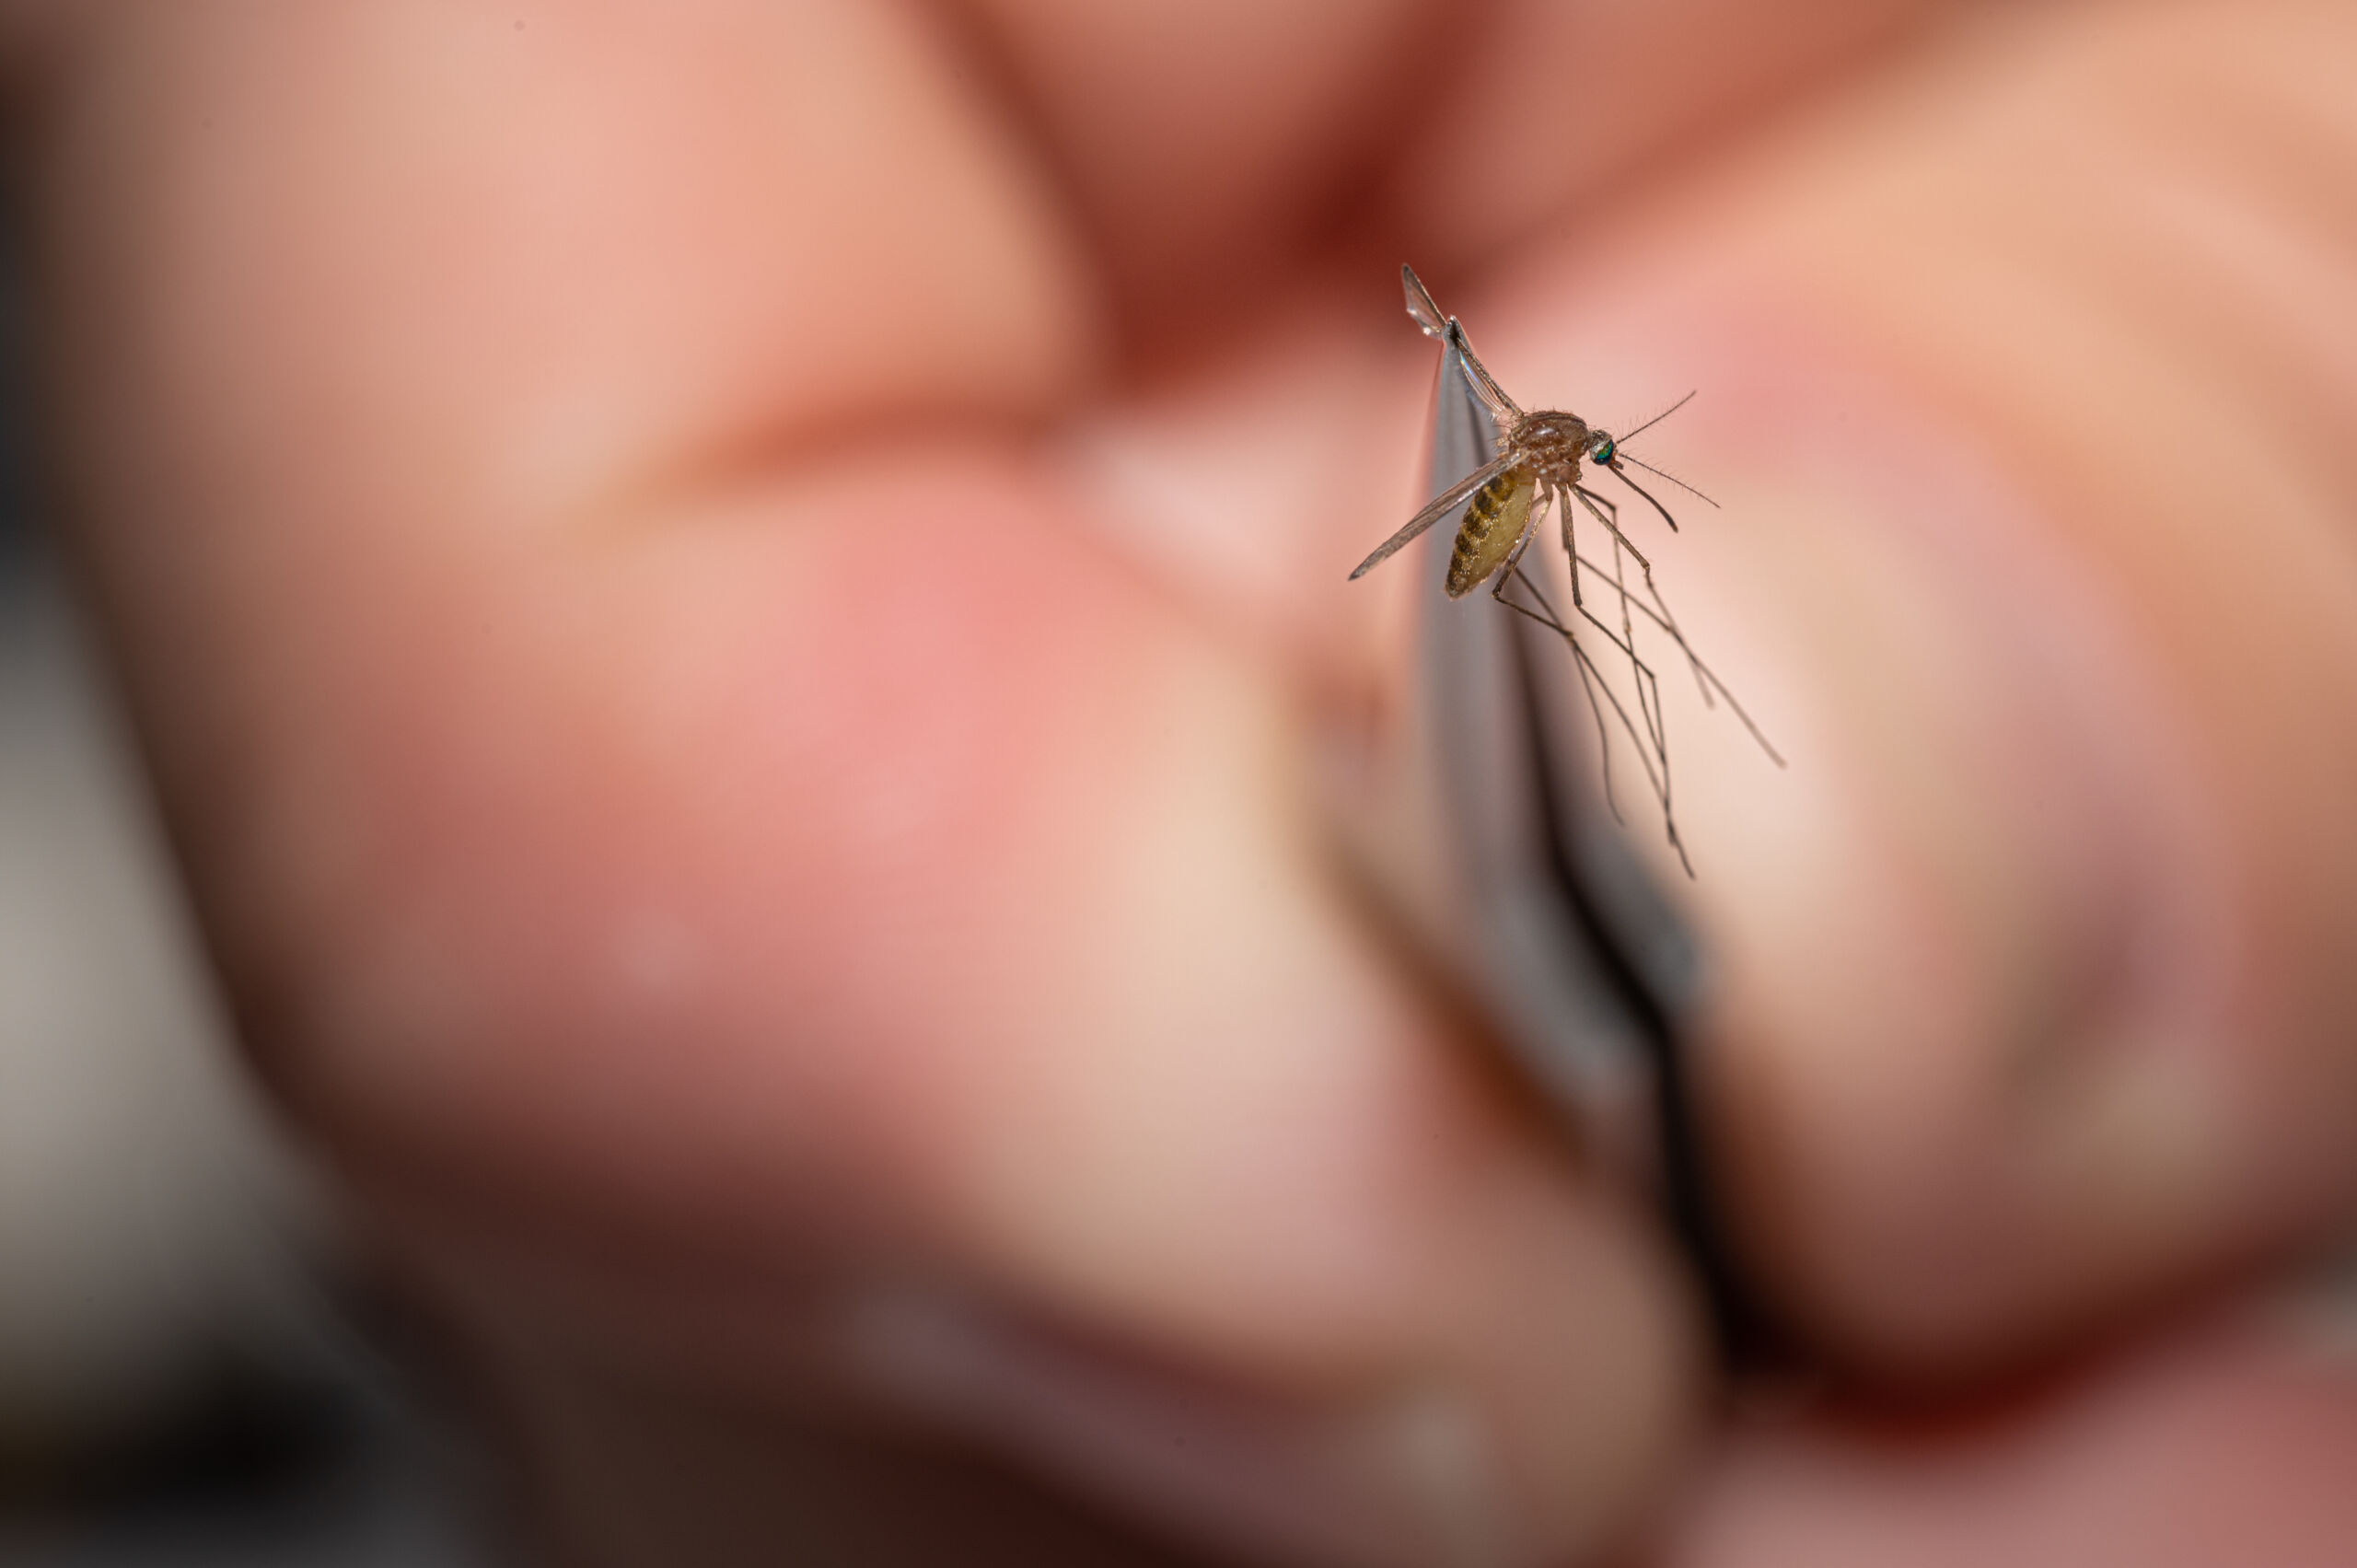
Enlarge / A mosquito collected to test for mosquito-borne diseases.
A small town in Massachusetts is urging residents to stay indoors in the evenings after the spread of a dangerous mosquito-spread virus reached “critical risk level.”
The virus causes Eastern equine encephalitis (EEE), which kills between 30 and 50 percent of people who are stricken—who are often children under the age of 15 and the elderly. Around half who survive are left permanently disabled, and some die within a few years due to complications. There is no treatment for EEE. So far, one person in the town—an elderly resident of Oxford—has already become seriously ill with neuroinvasive EEE.
EEE virus is spread by mosquitoes in certain swampy areas of the country, particularly in Atlantic and Gulf Coast states and the Great Lakes region. Mosquitoes shuttle the virus between wild birds and animals, including horses and humans. In humans, the virus causes very few cases in the US each year—an average of 11, according to the Centers for Disease Control and Prevention. But given the extreme risk of EEE, health officials take any spread seriously.
On August 16, the Massachusetts Department of Public Health announced the state’s first case and declared a “critical risk level” in the four communities of Douglas, Oxford, Sutton, and Webster. These all cluster in Worcester county near the state’s borders with Rhode Island and Connecticut.
Curfew
While the state health department did not identify the man as a resident of Oxford, the town’s manager confirmed his residence in a memorandum Wednesday. The manager, Jennifer Callahan, reported that the man remains hospitalized. She also reported that a horse across the border in Connecticut had recently died of EEE.
Also on Wednesday, the four towns—Douglas, Oxford, Sutton, and Webster—issued a joint health advisory, which included a recommended curfew.
Last night, The Oxford Board of Health voted to adopt the advisory, according to the Boston Globe. The recommendation is for residents to avoid mosquito’s peak activity time. They should “finish outdoor activities before 6: 00 PM through September 30th, 2024 and before 5: 00 PM October 1st, 2024 until the first hard frost.” The advisory also recommends residents wear insect repellent, wear protective clothing, and mosquito-proof their homes.
Officials emphasized that the curfew is a recommendation, not mandatory. However, to use town properties—such as recreation fields—people will first need to file an indemnification form and provide proof of adequate insurance coverage to the town.
To date, there have been only three cases of EEE in the US this year. One in Massachusetts, one in Vermont, and the last in New Jersey. All three are neuroinvasive. The CDC says that about 30 percent of cases are fatal, while Massachusetts health officials report that about half of people who develop EEE in the state have died.
In 2019, there was a multi-state outbreak of EEE, leading to a high of 38 cases. Twelve of the cases occurred in Massachusetts, and six died.
Town urges curfew over mosquito-spread disease that kills up to 50% of people Read More »


