carbon dioxide

everyone-agrees:-2024-the-hottest-year-since-the-thermometer-was-invented

Everyone agrees: 2024 the hottest year since the thermometer was invented


An exceptionally hot outlier, 2024 means the streak of hottest years goes to 11.

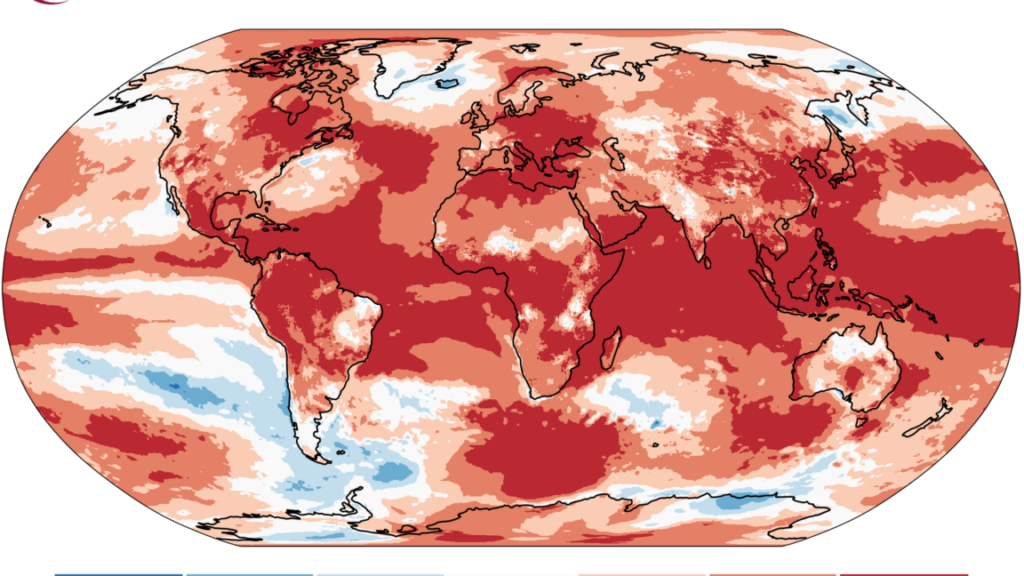
With very few and very small exceptions, 2024 was unusually hot across the globe. Credit: Copernicus

Over the last 24 hours or so, the major organizations that keep track of global temperatures have released figures for 2024, and all of them agree: 2024 was the warmest year yet recorded, joining 2023 as an unusual outlier in terms of how rapidly things heated up. At least two of the organizations, the European Union’s Copernicus and Berkeley Earth, place the year at about 1.6° C above pre-industrial temperatures, marking the first time that the Paris Agreement goal of limiting warming to 1.5° has been exceeded.

NASA and the National Oceanic and Atmospheric Administration both place the mark at slightly below 1.5° C over pre-industrial temperatures (as defined by the 1850–1900 average). However, that difference largely reflects the uncertainties in measuring temperatures during that period rather than disagreement over 2024.

It’s hot everywhere

2023 had set a temperature record largely due to a switch to El Niño conditions midway through the year, which made the second half of the year exceptionally hot. It takes some time for that heat to make its way from the ocean into the atmosphere, so the streak of warm months continued into 2024, even as the Pacific switched into its cooler La Niña mode.

While El Niños are regular events, this one had an outsized impact because it was accompanied by unusually warm temperatures outside the Pacific, including record high temperatures in the Atlantic and unusual warmth in the Indian Ocean. Land temperatures reflect this widespread warmth, with elevated temperatures on all continents. Berkeley Earth estimates that 104 countries registered 2024 as the warmest on record, meaning 3.3 billion people felt the hottest average temperatures they had ever experienced.

Different organizations use slightly different methods to calculate the global temperature and have different baselines. For example, Copernicus puts 2024 at 0.72° C above a baseline that will be familiar to many people since they were alive for it: 1991 to 2000. In contrast, NASA and NOAA use a baseline that covers the entirety of the last century, which is substantially cooler overall. Relative to that baseline, 2024 is 1.29° C warmer.

Lining up the baselines shows that these different services largely agree with each other, with most of the differences due to uncertainties in the measurements, with the rest accounted for by slightly different methods of handling things like areas with sparse data.

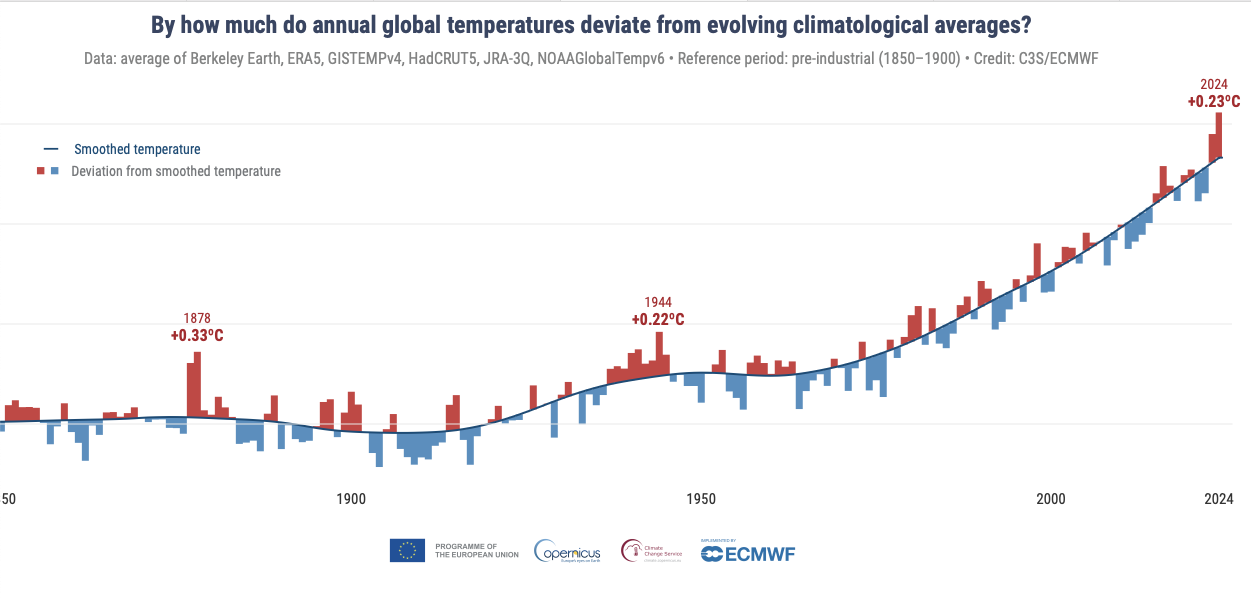
Describing the details of 2024, however, doesn’t really capture just how exceptional the warmth of the last two years has been. Starting in around 1970, there’s been a roughly linear increase in temperature driven by greenhouse gas emissions, despite many individual years that were warmer or cooler than the trend. The last two years have been extreme outliers from this trend. The last time there was a single comparable year to 2024 was back in the 1940s. The last time there were two consecutive years like this was in 1878.

A graph showing a curve that increases smoothly from left to right, with individual points on the curve hosting red and blue lines above and below. The red line at 2024 is larger than any since 1978.

Relative to the five-year temperature average, 2024 is an exceptionally large excursion. Credit: Copernicus

“These were during the ‘Great Drought’ of 1875 to 1878, when it is estimated that around 50 million people died in India, China, and parts of Africa and South America,” the EU’s Copernicus service notes. Despite many climate-driven disasters, the world at least avoided a similar experience in 2023-24.

Berkeley Earth provides a slightly different way of looking at it, comparing each year since 1970 with the amount of warming we’d expect from the cumulative greenhouse gas emissions.

A graph showing a reddish wedge, growing from left to right. A black line traces the annual temperatures, which over near the top edge of the wedge until recent years.

Relative to the expected warming from greenhouse gasses, 2024 represents a large departure. Credit: Berkeley Earth

These show that, given year-to-year variations in the climate system, warming has closely tracked expectations over five decades. 2023 and 2024 mark a dramatic departure from that track, although it comes at the end of a decade where most years were above the trend line. Berkeley Earth estimates that there’s just a 1 in 100 chance of that occurring due to the climate’s internal variability.

Is this a new trend?

The big question is whether 2024 is an exception and we should expect things to fall back to the trend that’s dominated since the 1970s, or it marks a departure from the climate’s recent behavior. And that’s something we don’t have a great answer to.

If you take away the influence of recent greenhouse gas emissions and El Niño, you can focus on other potential factors. These include a slight increase expected due to the solar cycle approaching its maximum activity. But, beyond that, most of the other factors are uncertain. The Hunga Tonga eruption put lots of water vapor into the stratosphere, but the estimated effects range from slight warming to cooling equivalent to a strong La Niña. Reductions in pollution from shipping are expected to contribute to warming, but the amount is debated.

There is evidence that a decrease in cloud cover has allowed more sunlight to be absorbed by the Earth, contributing to the planet’s warming. But clouds are typically a response to other factors that influence the climate, such as the amount of water vapor in the atmosphere and the aerosols present to seed water droplets.

It’s possible that a factor that we missed is driving the changes in cloud cover or that 2024 just saw the chaotic nature of the atmosphere result in less cloud cover. Alternatively, we may have crossed a warming tipping point, where the warmth of the atmosphere makes cloud formation less likely. Knowing that will be critical going forward, but we simply don’t have a good answer right now.

Climate goals

There’s an equally unsatisfying answer to what this means for our chance of hitting climate goals. The stretch goal of the Paris Agreement is to limit warming to 1.5° C, because it leads to significantly less severe impacts than the primary, 2.0° target. That’s relative to pre-industrial temperatures, which are defined using the 1850–1900 period, the earliest time where temperature records allow a reconstruction of the global temperature.

Unfortunately, all the organizations that handle global temperatures have some differences in the analysis methods and data used. Given recent data, these differences result in very small divergences in the estimated global temperatures. But with the far larger uncertainties in the 1850–1900 data, they tend to diverge more dramatically. As a result, each organization has a different baseline, and different anomalies relative to that.

As a result, Berkeley Earth registers 2024 as being 1.62° C above preindustrial temperatures, and Copernicus 1.60° C. In contrast, NASA and NOAA place it just under 1.5° C (1.47° and 1.46°, respectively). NASA’s Gavin Schmidt said this is “almost entirely due to the [sea surface temperature] data set being used” in constructing the temperature record.

There is, however, consensus that this isn’t especially meaningful on its own. There’s a good chance that temperatures will drop below the 1.5° mark on all the data sets within the next few years. We’ll want to see temperatures consistently exceed that mark for over a decade before we consider that we’ve passed the milestone.

That said, given that carbon emissions have barely budged in recent years, there’s little doubt that we will eventually end up clearly passing that limit (Berkeley Earth is essentially treating it as exceeded already). But there’s widespread agreement that each increment between 1.5° and 2.0° will likely increase the consequences of climate change, and any continuing emissions will make it harder to bring things back under that target in the future through methods like carbon capture and storage.

So, while we may have committed ourselves to exceed one of our major climate targets, that shouldn’t be viewed as a reason to stop trying to limit greenhouse gas emissions.

Photo of John Timmer

John is Ars Technica’s science editor. He has a Bachelor of Arts in Biochemistry from Columbia University, and a Ph.D. in Molecular and Cell Biology from the University of California, Berkeley. When physically separated from his keyboard, he tends to seek out a bicycle, or a scenic location for communing with his hiking boots.

Everyone agrees: 2024 the hottest year since the thermometer was invented Read More »

is-a-colonial-era-drop-in-co₂-tied-to-regrowing-forests?

Is a colonial-era drop in CO₂ tied to regrowing forests?

More trees, less carbon —

Carbon dioxide dropped after colonial contact wiped out Native Americans.

Image of a transparent disk against a blue background. The disk has lots of air bubbles embedded in it.

Enlarge / A slice through an ice core showing bubbles of trapped air.

British Antarctic Survey

Did the massive scale of death in the Americas following colonial contact in the 1500s affect atmospheric CO2 levels? That’s a question scientists have debated over the last 30 years, ever since they noticed a sharp drop in CO2 around the year 1610 in air preserved in Antarctic ice.

That drop in atmospheric CO2 levels is the only significant decline in recent millennia, and scientists suggested that it was caused by reforestation in the Americas, which resulted from their depopulation via pandemics unleashed by early European contact. It is so distinct that it was proposed as a candidate for the marker of the beginning of a new geological epoch—the “Anthropocene.”

But the record from that ice core, taken at Law Dome in East Antarctica, shows that CO2 starts declining a bit late to match European contact, and it plummets over just 90 years, which is too drastic for feasible rates of vegetation regrowth. A different ice core, drilled in the West Antarctic, showed a more gradual decline starting earlier, but lacked the fine detail of the Law Dome ice.

Which one was right? Beyond the historical interest, it matters because it is a real-world, continent-scale test of reforestation’s effectiveness at removing CO2 from the atmosphere.

In a recent study, Amy King of the British Antarctic Survey and colleagues set out to test if the Law Dome data is a true reflection of atmospheric CO2 decline, using a new ice core drilled on the “Skytrain Ice Rise” in West Antarctica.

Precious tiny bubbles

In 2018, scientists and engineers from the British Antarctic Survey and the University of Cambridge drilled the ice core, a cylinder of ice 651 meters long by 10 centimeters in diameter (2,136 feet by 4 inches), from the surface down to the bedrock. The ice contains bubbles of air that got trapped as snow fell, forming tiny capsules of past atmospheres.

The project’s main aim was to investigate ice from the time about 125,000 years ago when the climate was about as warm as it is today. But King and colleagues realized that the younger portion of ice could shed light on the 1610 CO2 decline.

“Given the resolution of what we could obtain with Skytrain Ice Rise, we predicted that, if the drop was real in the atmosphere as in Law Dome, we should see the drop in Skytrain, too,” said Thomas Bauska of the British Antarctic Survey, a co-author of the new study.

The ice core was cut into 80-centimeter (31-inch) lengths, put into insulated boxes, and shipped to the UK, all the while held at -20°C (-4°F) to prevent it from melting and releasing its precious cargo of air from millennia ago. “That’s one thing that keeps us up at night, especially as gas people,” said Bauska.

In the UK they took a series of samples across 31 depth intervals spanning the period from 1454 to 1688 CE: “We went in and sliced and diced our ice core as much as we could,” said Bauska. They sent the samples, still refrigerated, off to Oregon State University where the CO2 levels were measured.

The results didn’t show a sharp drop of CO2—instead, they showed a gentler CO2 decline of about 8 ppm over 157 years between 1516 and 1670 CE, matching the other West Antarctic ice core.

“We didn’t see the drop,” said Bauska, “so we had to say, OK, is our understanding of how smooth the records are accurate?”

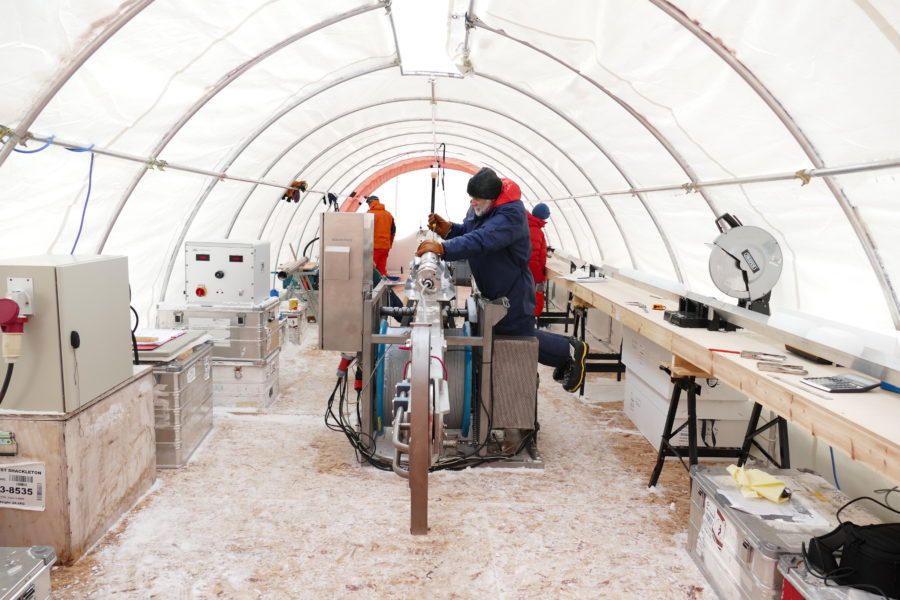
A tent on the Antarctic ice where the core is cut into segments for shipping.

A tent on the Antarctic ice where the core is cut into segments for shipping.

British Antarctic Survey

To test if the Skytrain ice record is too blurry to show a sharp 1610 drop, they analyzed the levels of methane in the ice. Because methane is much less soluble in water than CO2, they were able to melt continuously along the ice core to liberate the methane and get a more detailed graph of its concentration than was possible for CO2. If the atmospheric signal was blurred in Skytrain, it should have smoothed the methane record. But it didn’t.

“We didn’t see that really smoothed out methane record,” said Bauska, “which then told us the CO2 record couldn’t have been that smoothed.”

In other words, the gentler Skytrain CO2 signal is real, not an artifact.

Does this mean the sharp drop at 1610 in the Law Dome data is an artifact? It looks that way, but Bauska was cautious, saying, “the jury will still be out until we actually get either re-measurements of the Law Dome, or another ice core drilled with a similarly high accumulation.”

Is a colonial-era drop in CO₂ tied to regrowing forests? Read More »

mars-may-not-have-had-liquid-water-long-enough-for-life-to-form

Mars may not have had liquid water long enough for life to form

Subliminal —

Lab experiments suggest gullies on Mars might form when carbon dioxide heats up.

Image of a grey-colored slope with channels cut into it.

Mars has a history of liquid water on its surface, including lakes like the one that used to occupy Jezero Crater, which have long since dried up. Ancient water that carried debris—and melted water ice that presently does the same—were also thought to be the only thing driving the formation of gullies spread throughout the Martian landscape. That view may now change thanks to new results that suggest dry ice can also shape the landscape.

It’s sublime

Previously, scientists were convinced that only liquid water shaped gullies on Mars because that’s what happens on Earth. What was not taken into account was sublimation, or the direct transition of a substance from a solid to a gaseous state. Sublimation is how CO2 ice disappears (sometimes water ice experiences this, too).

Frozen carbon dioxide is everywhere on Mars, including in its gullies. When CO2 ice sublimates on one of these gullies, the resulting gas can push debris further down the slope and continue to shape it.

Led by planetary researcher Lonneke Roelofs of Utrecht University in the Netherlands, a team of scientists has found that the sublimation of CO2 ice could have shaped Martian gullies, which might mean the most recent occurrence of liquid water on Mars may have been further back in time than previously thought. That could also mean the window during which life could have emerged and thrived on Mars was possibly smaller.

“Sublimation of CO2 ice, under Martian atmospheric conditions, can fluidize sediment and creates morphologies similar to those observed on Mars,” Roelofs and her colleagues said in a study recently published in Communications Earth & Environment.

Into thin air

Earth and Martian gullies have basically the same morphology. The difference is that we’re certain that liquid water is behind their formation and continuous shaping and re-shaping on Earth. Such activity includes new channels being carved out and more debris being taken to the bottom.

While ancient Mars may have had enough stable liquid water to pull this off, there is not enough on the present surface of Mars to sustain that kind of activity. This is where sublimation comes in. CO2 ice has been observed on the surface of Mars at the same time that material starts flowing.

After examining observations like these, the researchers hypothesized these flows are pushed downward by gas as the frozen carbon dioxide sublimates. Because of the low pressure on Mars, sublimation creates a relatively greater gas flux than it would on Earth—enough power to make fluid motion of material possible.

There are two ways sublimation can be triggered to get these flows moving. When part of a more exposed area of a gully collapses, especially on a steep slope, sediment and other debris that have been warmed by the Sun can fall on CO2 ice in a shadier and cooler area. Heat from the falling material could supply enough energy for the frost to sublimate. Another possibility is that CO2 ice and sediment can break from the gully and fall onto warmer material, which will also trigger sublimation.

Mars in a lab

There is just one problem with these ideas: since humans have not landed on Mars (yet), there are no in situ observations of these phenomena, only images and data beamed back from spacecraft. So, everything is hypothetical. The research team would have to model Martian gullies to watch the action in real time.

To re-create a part of the red planet’s landscape in a lab, Roelofs built a flume in a special environmental chamber that simulated the atmospheric pressure of Mars. It was steep enough for material to move downward and cold enough for CO2 ice to remain stable. But the team also added warmer adjacent slopes to provide heat for sublimation, which would drive movement of debris. They experimented with both scenarios that might happen on Mars: heat coming from beneath the CO2 ice and warm material being poured on top of it. Both produced the kinds of flows that had been hypothesized.

For further evidence that flows driven by sublimation would happen under certain conditions, two further experiments were conducted, one under Earth-like pressures and one without CO2 ice. No flows were produced by either.

“For the first time, these experiments provide direct evidence that CO2 sublimation can fluidize, and sustain, granular flows under Martian atmospheric conditions,” the researchers said in the study.

Because this experiment showed that gullies and systems like them can be shaped by sublimation and not just liquid water, it raises questions about how long Mars had a sufficient supply of liquid water on the surface for any organisms (if they existed at all) to survive. Its period of habitability might have been shorter than it was once thought to be. Does this mean nothing ever lived on Mars? Not necessarily, but Roelofs’ findings could influence how we see planetary habitability in the future.

Communications Earth & Environment, 2024. DOI: 10.1038/s43247-024-01298-7

Mars may not have had liquid water long enough for life to form Read More »

seeking-another-earth?-look-for-low-carbon-dioxide

Seeking another Earth? Look for low carbon dioxide

Where’d all the CO2 go? —

In our own Solar System, Earth has far lower CO2 concentrations than its neighbors.

Image of a series of planets with different surfaces, arrayed in front of a star.

What do we need to find if we want to discover another Earth? If an exoplanet is too far away for even the most powerful telescopes to search directly for water or certain biosignatures, is there something else that may tell us about the possibility of habitability? The answer could be carbon dioxide.

Led by Amaury Triaud and Julien de Wit, an international team of researchers is now proposing that the absence of CO2 in a planet’s atmosphere potentially increases the chances of liquid water on its surface. Earth’s own atmosphere is depleted of CO2. Unlike dry Mars and Venus, which have high concentrations of CO2 in their atmospheres, oceans on our planet have taken immense amounts of carbon dioxide out of the atmosphere because the gas dissolves in water. CO2 deficits in exoplanet atmospheres might mean the same.

Another molecule could be a sign of a habitable planet: ozone. Many organisms on Earth (especially plants) breathe carbon dioxide and release oxygen. This oxygen reacts with sunlight and becomes O3, or ozone, which is easier to detect than atmospheric oxygen. The presence of ozone and the absence of carbon dioxide could mean a habitable, and even inhabited, planet.

Anyone—or anything—out there?

There is a difference between a planet orbiting within what is considered a habitable zone and actual habitability. Habitability is defined by the researchers as “a planet’s capacity to retain large reservoirs of surface liquid water,” as they state in a study recently published in Nature Astronomy.

Proving that water actually exists could hypothetically be done in many ways. The problem is that most existing telescopes, no matter how advanced, are incapable of pulling them all off. Finding liquid water from light years away is not as easy as seeing the glimmer of a lake, though that is possible at short distances, like those within our own Solar System. (When sunlight reflects off a body of surface liquid, what scientists refer to as a “glint” can be seen, which is how the lakes and oceans on Saturn’s moon Titan were discovered.)

Beyond water, other factors could determine habitability. Besides atmospheric properties, these include (but are not limited to) the orbit of a planet, plate tectonics, magnetic fields, and how it is affected by its star.

When less is more

Triaud, de Wit, and their team argue that it’s worth trying to identify potentially habitable planets that belong to a system similar to ours. If there is a system with several terrestrial planets that are close in size and have atmospheres, this makes it possible to compare carbon dioxide content in their atmospheres and see if there is a significant deficit in one or more planets compared to the others.

While a CO2 deficit does not guarantee that there is liquid water on the surface, it should give scientists a reason to observe the planet or planets in question more closely. We don’t have to look far from Earth to see why this makes sense. Not only has most of the carbon dioxide in our planet’s atmosphere been depleted by its oceans, but plate tectonics also bury it in the crust. The amount of early Earth’s atmospheric carbon dioxide that ended up trapped in rocks is almost equal to the amount of CO2 in the entire atmosphere of Venus.

There is another advantage to searching for this deficit. Because it’s an especially strong infrared light absorber, CO2 is rather easy to detect. Telescopes that are around today, including NASA’s James Webb Telescope and ESO’s Very Large Telescope, as well as ESO’s upcoming Extremely Large Telescope, have infrared vision that can easily search for CO2 signatures.

So what if we did find a planet that showed a deficit of CO2 and the presence of ozone? The researchers think the combination of both could mean not just a few microbial life forms but, at least hypothetically, a planet alive with organisms.

“Life on Earth is planet-shaping,” the team said in the same study. “Planet-shaping life is really what astronomers are after.”

Nature Astronomy, 2023.  DOI:  10.1038/s41550-023-02157-9

Seeking another Earth? Look for low carbon dioxide Read More »